Datasheets lead with sequential bandwidth. The numbers that actually limit a drive are decided earlier, in places the firmware cannot rewrite. Firmware and NAND physics still matter, but they can’t rescue a drive on the wrong protocol or link, or in a package that overheats.
Flash Foundations
Flash Foundations, Part 1: Standards & Interfaces
Trace the standards, interfaces and form factors that limit a drive before its firmware runs.
On this page 21 sections
Flash Foundations is a ten-part series about NAND flash at the engineering level. It covers the physics, the architecture and the design decisions behind how a solid-state drive (SSD) behaves under real load. This part sets the envelope, the external limits that every later part works inside. Which commands the drive answers comes down to the Non-Volatile Memory Express (NVMe) protocol. How much bandwidth that conversation can use comes down to the Peripheral Component Interconnect Express (PCIe) link. Whether the controller can hold that bandwidth without throttling depends on the form factor.
Which limits are fixed before the first line of firmware runs, and how do you read them on a real drive? By the end of this part you can name the body that writes each rule, work out what a link can carry, tell what a bay will accept, and set up a test that measures steady state instead of a burst.
Who writes the rules for each layer
Every drive follows several standards at once, and a different body writes each one. Published rules come from JEDEC, NVM Express, the PCI Special Interest Group (PCI-SIG), the Storage Networking Industry Association (SNIA), SATA-IO and INCITS. They cover NAND parts and buses, host protocols, links, connectors and test methods.
Who writes the rules for each layer
Each layer from the host to the NAND part has its own rule writer
Who publishes what, from the top of the stack down
Figure 1.1 puts each body on the layer it writes. Most bodies meet at the host link. PCI-SIG owns PCIe, and SATA-IO owns the Serial ATA (SATA)SATA is the serial interface for storage that tops out at 6Gb/s, or 600MB/s on the wire before overhead, with one command queue of 32 entries. specification. INCITS T10 (Small Computer System Interface, SCSI) and T13 (AT Attachment, ATA) own the legacy protocol specifications behind Serial Attached SCSI (SAS)SAS is the serial interface used by enterprise drives. It supports dual ports, long cables and expanders, and speaks the SCSI command set. and SATA. Compute Express Link (CXL), which runs on the PCIe wires, belongs to the CXL Consortium.
A drive can satisfy one body and still be wrong for a platform, because passing one body’s tests says nothing about another’s. The site’s Standards page lists the dated releases for each body.
JEDEC: the NAND part and the NAND bus
JEDEC publishes the electrical and reliability specifications for semiconductor memory, including NAND flash. Its electrical specifications cover package pinout, interface voltage and the timing windows the controller must respect on read, program and erase. Those windows have names: tR is page read time, tPROG is program time and tBERS is block erase time. Part 3 gives their values and what moves them. Controller firmware is built around these windows, and violating them corrupts data.
For reliability, JEDEC defines the qualification tests that decide whether a NAND component is production-ready. JESD47 is the stress-test standard. It uses accelerated life testing at elevated temperature and voltage to compress years of field aging into weeks. JESD22 is a family of environmental tests, such as temperature cycling, humidity and vibration. Drive-level endurance is a different book. JESD218 is the SSD endurance method, and JESD219 is the workload that method assumes.
Between the NAND die and the controller sits the raw NAND interface. That interface is either the Open NAND Flash Interface (ONFI) or Toggle Mode. The ONFI 6.0 specification names Micron, Phison, Western Digital, SK hynix and Sony as its authors, and Toggle DDR came from Samsung and Toshiba (now Kioxia), who announced in 2010 that they had started taking part in JEDEC standardization of it. JESD230 is the interoperability layer JEDEC and ONFI wrote together (as of October 2026 the current revision is JESD230G.02, September 2026), so a controller can talk to asynchronous, synchronous double data rate and Toggle double data rate packages without a unique pinout per vendor. Both are source-synchronous, meaning the sender drives a strobe (DQS) alongside the data lines (DQ), eight of them in a x8 package, and the receiver captures data on both edges of that strobe.
Who writes the rules for each layer
Both NAND buses move data on both edges of a strobe sent with it
Source-synchronous double data rate, drawn with no vendor marks
Figure 1.2 draws that shared mechanism once for each family. The two families differ in control signaling and timing rules, and both use double data rate. A controller must support whichever interface its NAND uses, or both if it aims for broad compatibility, so mixing NAND from different vendors is not a drop-in swap. Part 5 covers bus speeds and how the controller drives the bus. Kioxia’s JESD230 write-up is a readable walk through the current additions, though it doesn’t replace the standard.
SNIA, T10, T13 and SATA-IO
SNIAThe SNIA Performance Test Specification sets a repeatable method for measuring SSDs: precondition the drive, reach steady state, then record. publishes the Solid State Storage Performance Test Specification (PTS), the baseline for honest device-level SSD comparison. Following PTS separates a characterization from a cherry-picked burst, and the field section below applies it. The SSD Benchmarking 101 series makes the argument behind it. SNIA’s SSD form factor overview is the mechanical half of the same story. SFF-TA-1006 specifies E1.S and SFF-TA-1008 specifies E3. The small form factor (SFF) specification catalog is where those document numbers live.
INCITS T10 and T13 still own the protocol specifications that SAS and SATA derive from, and SATA-IO publishes the SATA specification itself. Today the SNIA STA Forum is the SAS industry community that used to be the SCSI Trade Association. Both interfaces remain relevant in the installed base, even as NVMe takes new designs.
How NVMe replaced AHCI
NVMe is how a host talks to a solid-state device over PCIe. NVMe over Fabrics (NVMe-oF) carries it over a network too. Before NVMe, SSDs borrowed the Advanced Host Controller Interface (AHCIAHCI, the Advanced Host Controller Interface, is the register-level interface that SATA drives use, built around a single command queue of 32 entries.). That host interface was built for spinning disks and has one command list per port, 32 slots deep. NVMe’s base specification allows up to 65,535 I/O queues, each holding up to 65,535 outstanding commands.
How NVMe replaced AHCI
AHCI shares one queue, and NVMe gives each core its own
Queue structure, not drive speed, is what differs
Figure 1.3 shows the structural difference. NVMe hosts usually give each CPU core its own submission queue (SQ)NVMe uses pairs of queues in host memory: the host places commands in a submission queue and the drive reports results in a completion queue. and completion queue (CQ); the specification allows many queues but does not require one pair per core. The host writes a command into its SQ and rings a doorbell register to tell the drive, which posts the result to the paired CQ. With a pair per core, cores do not take turns on a shared structure. AHCI shares one list, so every command passes through one 32-slot window.
This is why a modern NVMe SSD can deliver hundreds of thousands of input/output operations per second (IOPSIOPS counts commands finished per second. Queue depth is how many commands are outstanding at once, and a drive needs a deeper queue to reach its top IOPS.) where a SATA SSD manages far less, at a queue depth (QD) of 32: Samsung’s 870 EVO data sheet lists 98,000 read IOPS at QD32 and 13,000 at QD1. A 6Gb/s SATA link carries about 600MB/s, which caps 4KB transfers near 146,000 per second. Queue depth is how many commands are outstanding at once. Deeper queues let the controller group and reorder commands against NAND, and Part 5 covers how it spreads them across channels and dies. Everyday desktop work lives near QD1, so spec-sheet IOPS at QD32 or QD128 describe a different workload.
NVMe also defines the feature set the drive exposes. Namespaces let one physical device present multiple logical volumes. Power states let the host and the drive negotiate idle savings. Sanitize covers block erase, cryptographic erase or overwrite. Telemetry log pages give a standard way to pull vendor debug data, and the SMART / Health Information log gives the structured health view. Part 8 holds the field reference for those counters.
The NVMe library: command sets and transports
NVMe 2.0 broke the 1.x monolith into a library made of a base specification, separate I/O command sets such as Zoned Namespace (ZNS) and Key Value (KV), independent transport bindings for PCIe, remote direct memory access (RDMA) and TCP, and a management interface (NVMe-MI) for out-of-band management. That split is still the right way to read NVMe. Command sets and transports can move without waiting for a single giant revision.
The NVMe library: command sets and transports
Command sets and transports plug into one base specification
Since NVMe 2.0 the library is separate documents, not one specification
Figure 1.4 shows the layering. Every device shares queues, admin commands, namespaces and security, and the base specification holds them. Command sets sit above it and define what the drive can be asked to do. Transports sit below it and define how commands travel. A connector that looks identical can hide devices from different revisions of the library, with different feature sets, so the Identify data shows what a drive implements.
| Document | What it adds |
|---|---|
| Base specification | Queues, admin commands, power, namespaces, security and multipath. Sanitize, telemetry and namespace management live here |
| NVM command set | Standard block I/O over any transport: read, write, compare, and dataset management (TRIM). Copy moves data between logical block address (LBA) ranges inside the drive without a host round trip |
| ZNS command set | Sequential write zones. The host owns write ordering |
| KV command set | Store, retrieve, list, delete and exist by key, which drops the host-side key-to-block map. A specialist feature, not a consumer one |
| Computational Programs command set | Programs that run against data on the device. Implementation is still a product question |
| Subsystem Local Memory command set | Memory local to the NVM subsystem, exposed as a memory namespace instead of an LBA namespace |
| PCIe transport | Register map, doorbells, interrupts and PCI power management for the local SSD case |
| RDMA transport | Binding to RDMA over Converged Ethernet (RoCE) or InfiniBand. Lowest-latency fabric path, but it needs RDMA hardware |
| TCP transport | Binding to TCP/IP over standard Ethernet |
| Boot specification | Booting from NVMe is specified instead of being tribal knowledge |
| NVMe-MI | Out-of-band and in-band management of thermals, firmware update and health |
Whether a drive implements a given command set is a product and firmware question. ZNS pushes work toward the host, which manages zone write ordering in exchange for less garbage collectionGarbage collection copies the valid pages out of mostly stale blocks and erases those blocks, so there is always free space for new writes. (GC) and less internal translation. The drive’s background reclaim of stale blocks is covered in Part 7. Part 10 covers where ZNS stands. With KV, the drive owns the key-to-location map, and the host drops its own key-to-block layer. Simple Copy and computational programs move work onto the device. NVMe 2.4 adds persistent lockdown settings, covered at the end of this part. These choices change what the drive does and what the system around it must provide, so the NVMe revision on a device matters long before you touch firmware or run a benchmark.
PCIe link generations, encoding and signaling
PCI-SIG publishes the PCIe base specification, the physical and logical signaling layer that NVMe and CXL both ride on. PCIe defines link trainingLink training is the handshake at power-up where two PCIe devices agree on a speed and width. The result is readable in the link status register, LnkSta., lane configuration and the electrical margins at each generation. A laneA PCIe lane is one pair of transmit wires and one pair of receive wires. A link bundles one, two, four, eight or sixteen lanes. is one pair of transmit wires and one pair of receive wires, and most storage links are x1, x2 or x4. If you need the GT/s ladder without opening the member PDF, the PCI-SIG FAQ for 5.0 is a clean generation recap. NVMe is the protocol layer on top. PCIe itself is a general-purpose interconnect used for graphics cards and network adapters too, and NVMe is what turns a PCIe connection into a storage conversation.
Each generationEach PCIe generation roughly doubles the per-lane transfer rate, so the same x4 link carries more data in every new generation. doubles the previous one. Gen3 delivers about 4GB/s across an x4 link, at 8GT/s per lane with 128b/130b encoding. That encoding sends 128 payload bits in every 130 on the wire, so it costs under 2% of the bits. Gen4 doubles the rate to about 8GB/s, and Gen5 to about 16GB/s. PCIe 6.0 doubles once more, to 64GT/s raw, about 32GB/s on an x4 before overhead and roughly 30GB/s after it. PCIe 7.0 runs at 128.0GT/s, double the 64.0GT/s of PCIe 6.x, according to PCI-SIG. Part 10 covers it.
Gen6 does that with four-level pulse amplitude modulation (PAM4NRZ sends one bit per symbol on two voltage levels. PAM4 sends two bits on four levels, which doubles the data rate but shrinks the noise margin.) instead of the non-return-to-zero (NRZ) signaling that carried Gen3 through Gen5. NRZ sends one bit per symbol on two voltage levels. PAM4 sends two bits per symbol on four levels. PCIe 6.0 also moves to FLITFLIT mode, introduced with PCIe 6.0, sends data in fixed-size units protected by forward error correction instead of variable-length packets. (flow control unit) mode, which sends fixed-size units protected by forward error correction (FEC) and a cyclic redundancy check (CRC) instead of variable-length packets.
PCIe link generations, encoding and signaling
Each PCIe generation doubles the x4 rate, and Gen6 adds PAM4
Link rate on an x4 link before protocol overhead
Figure 1.5 sets the four generations on one axis. Gen3 to Gen5 double on the same NRZ signaling by shortening the unit interval (UI). The UI is the time one symbol occupies, and it is 125ps at Gen3, 62.5ps at Gen4 and 31.25ps at Gen5. Gen6 keeps the 31.25ps UI and gets its doubling from the second bit in every symbol. Per lane, that is about 1GB/s at Gen3 and about 4GB/s at Gen5.
Signal integrity gets harder every generation. Gen3 was forgiving. At Gen5 trace geometry, connector quality and equalization stop being optional, which, together with controller power and heat, is why Gen5 SSDs showed up in high-end desktops before laptops. Gen6 is stricter. PAM4 packs two bits into the same UI, so each voltage eye is smaller, and retimers and compliance programs matter. Part 10 follows how the ecosystem handles it.
That margin is spent in the copper. A board is a stack of copper layers separated by fiberglass laminate and tied together with vias. PCIe lanes run as differential pairs, and the board has to hold their impedance along the whole route. TI’s layout guide gives 85Ω differential impedance for add-in cards on the lanes, with 100Ω on the reference clock. Each transmit lane also passes through a small series capacitor (the AC-coupling capacitor) that blocks DC between the two ends of the link. Vias, stubs and connector transitions each take a share of the loss budget, so the board matters more with every generation.
From link rate to drive throughput
Link-level byte rates from the previous section overstate storage throughput. Part of the gap is packet overhead. Every transaction layer packet (TLP) wraps its payload in a header of 12 or 16 bytes and a 2-byte sequence number. Link CRC adds 4 bytes, framing adds 2 bytes at Gen2 or 4 at Gen3, and an optional end-to-end CRC adds 4 more. Xilinx’s PCIe performance white paper puts that at 20 to 30 bytes per packet and works one case: with a 12-byte header and no end-to-end CRC, the overhead is 20 bytes at Gen2 and 22 at Gen3, so a 256-byte maximum payload size (MPS) is about 92% efficient either way and a 128-byte MPS is about 86%. Acknowledgment, flow-control and clock-compensation traffic take a further share. Applying the 92% to the 3.94GB/s Gen3 x4 rate gives about 3.6GB/s before that traffic, close to the 3.5GB/s rating of the Gen3 drive in the table below. No drive was measured here, so treat that as an estimate.
From link rate to drive throughput
Drives read below the link rate after line coding
Link rate after encoding beside a maker-rated sequential read
Figure 1.6 puts the link rate after line coding beside a maker-rated sequential read for each interface. The SATA, Gen3, Gen4 and Gen5 drives are consumer models, and the Gen6 drive is a data-center model. The Gen3 rating sits about 11% under the link, the Gen4 rating about 5% under and the Gen5 rating about 7% under. The Gen6 rating is also about 7% under, and the link rate shown there is already the roughly 30GB/s after FLIT overhead. Packet overhead alone takes about 14% at a 128-byte MPS, 8% at 256 and 4% at 512, so gaps of this size are within what packet overhead can account for before any controller limit. SATA III sits about 7% under, 560MB/s against a 600MB/s cap, because the 6Gb/s line limits it.
Headroom lets faster NAND and deeper queues show up as real performance. It does not shorten a single small read. tR is the time to read a page into the buffer, and it didn’t double with the link, so QD1 latency doesn’t follow the sequential figure. Gen6 can move more data per second. It cannot make a triple-level cell (TLC, three bits per cell) page read faster, and Part 2 covers how cell type sets that time. If the workload is small-block and queue-shallow, you feel NAND and firmware instead of the extra link bandwidth.
Gen5 already showed the thermal problem: controllers and the physical layer (PHY) run hot enough that drives need heatsinks or real airflow under sustained load. I covered that gap between the datasheet peak and what a thermally limited drive holds in The Visionary of PCIe 5.0. Gen6 doesn’t change that: the slot sets the generation the link trains at, and the power and cooling set whether the drive holds it.
Each interface gets one maker-rated sequential read. It is an up-to rating and not a measurement here. The rows mix drive classes, so the table names each one, and the last column is a reading of the likely limit rather than a measured result.
| Interface | Protocol | Rated sequential read | Drive class | Likely limit (a reading) |
|---|---|---|---|---|
| SATA III | AHCI | 560MB/s, Samsung 870 EVO | Consumer | 6Gb/s link with 8b/10b encoding, one direction at a time, and a 32-slot queue |
| PCIe 3.0 NVMe | NVMe | 3,500MB/s, Samsung 970 EVO Plus | Consumer | The x4 link, about 4GB/s |
| PCIe 4.0 NVMe | NVMe | 7,450MB/s, Samsung 990 PRO | Consumer | The x4 link, about 8GB/s |
| PCIe 5.0 NVMe | NVMe | 14,700MB/s, Samsung 9100 PRO | Consumer | The x4 link, about 16GB/s |
| PCIe 6.0 NVMe | NVMe | 28GB/s, Micron 9650 | Data center | PAM4 signal integrity, power and cooling, and FLIT overhead |
Those ratings sit below the x4 link rates, and SATA uses a single lane. QD1 read latency is missing from the table because the NAND and the firmware path set it. CXL is missing too, since it isn’t block I/O.
The ceilings of SATA and SAS
SATA was the dominant client storage interface for more than a decade, and it is still widely deployed. SATA throughput is capped at about 600MB/s, well below what modern NAND can do. That cap comes from the 6Gb/s line rate. With every byte sent as a 10-bit code (8b/10bLine encoding adds structure to a serial bit stream so the receiver can recover the clock. 8b/10b costs 20% of the bits, while 128b/130b costs under 2%.), 6Gb/s × 8/10 ÷ 8 leaves 600MB/s. Earlier generations ran at 1.5 and 3Gb/s, so 150 and 300MB/s. Samsung’s 870 EVO data sheet lists a SATA 6Gb/s interface, compatible with 3 and 1.5Gb/s hosts, and 560MB/s sequential read, just under the cap. It also carries data in one direction at a time.
The ceilings of SATA and SAS
A 6Gb/s SATA link carries 600MB/s once 8b/10b coding is counted
Line rate to data rate, then the 4KB command ceiling
Figure 1.7 walks that arithmetic. Line coding sets the cap, so no faster NAND or controller can lift it. For many workloads that doesn’t matter, since operating system boots, application launches and general file access are rarely limited by the interface at SATA speeds.
SATA hosts use AHCI on the host side, and the drive side uses Native Command Queuing (NCQ). Both stop at 32 outstanding commands, a limit that predates the parallelism demands of solid-state storage. NCQ let a hard drive reorder commands to save seeks and rotation. On an SSD the same queue’s job is to keep channels and dies busy, and 32 slots is a ceiling that shows up under sustained mixed workloads.
SATA also defines how the link sleeps. Partial leaves the link in a reduced-power condition from which the specification requires a wake in no more than 10µs. Slumber saves more, and the link must wake in no more than 10ms. Either the host or the device can ask for a sleep state, and the other side can accept or refuse it. Wake-up is signaled out of band, before the data link is up, and the same out-of-band signaling brings the link up at boot. Host and device exchange reset and initialization signals, then negotiate the highest speed they share, falling back from 6Gb/s to 3 or 1.5Gb/s if the higher rate will not hold. Power-saving settings explain some odd latency spikes on SATA drives, and a drive that works but runs below its port speed is a link problem rather than a NAND problem. Reading the negotiated speed is covered in the field section below.
SATA remains relevant in cost-sensitive client markets, in legacy enterprise deployments, and anywhere platform constraints make NVMe impractical, such as an older host, a fixed connector or a backplane that will not change. Knowing why it exists prevents two mistakes. One is dismissing it entirely, and the other is recommending NVMe where the platform cannot use it.
SAS is the enterprise interface that preceded broad NVMe adoption in the data center. On August 8, 2017 the SCSI Trade Association said that development of the 24G SAS specification was complete and that it is backward compatible with 12Gb/s and 6Gb/s SAS but uses a different encoding scheme from earlier generations. SAS-4 runs 22.5Gb/s per lane, the rate behind 24G SAS. NVMe is taking new enterprise designs, and the installed SAS base does not disappear in a product cycle, so SAS still matters if you sell into or support existing enterprise storage. On latency, SAS and SATA carry SCSI acknowledgment overhead that the slimmer NVMe protocol avoids, according to the NVM Express FAQ.
NVMe-oF: the drive in another chassis
NVMe-oF extends NVMe beyond the local PCIe connection. A drive doesn’t have to sit in the same chassis as the server. Storage can be pooled across a data center, and the host reaches remote media with the same NVMe commands it uses for a local drive.
Its main fabrics are RDMA over RoCE or InfiniBand, TCP over ordinary Ethernet, and Fibre Channel in existing storage area networks, which reaches NVMe through a separate mapping outside the NVMe transport documents. RDMA wins latency and loses hardware flexibility. NVMe over TCP takes the latency hit and runs on the network you already have. It defines Transport Layer Security (TLS) 1.3 and DH-HMAC-CHAP for in-band security, both optional. Where TLS is used, it is based on pre-shared key (PSK) authentication rather than certificates.
NVMe-oF: the drive in another chassis
NVMe over Fabrics sends the same commands over multiple paths
Host, fabric and target, with two paths to one namespace
Figure 1.8 shows the path. High-availability deployments extend the redundancy model through Asymmetric Namespace Access (ANA). A namespace can be reachable through multiple controller ports at once, and each path reports one of five states: optimized, non-optimized, inaccessible, persistent loss, or change while it transitions. A host multipath driver sends I/O to optimized paths under normal conditions and fails over to non-optimized paths without interrupting the application. This is the NVMe equivalent of Asymmetric Logical Unit Access (ALUA) in SCSI arrays over Fibre Channel, iSCSI or SAS.
A drive reports ANA state through the ANA log page, and it signals changes to the host with an asynchronous event notification, so the multipath driver does not have to poll. Linux’s native NVMe multipath is the implementation most operators run. NVM Express’s NVMe-oF 1.1 Q&A explains why ANA showed up as a fabric problem rather than a local-drive problem.
NVMe-oF is the architectural basis for modern disaggregated storage. Compute and storage scale independently instead of being physically co-located. That matters if you work in cloud, hyperscale or enterprise storage architecture.
CXL, the same bay with a different job
CXL uses the same PCIe wires NVMe uses, but the conversation is different. NVMe is queues and block commands. CXL is cache-coherent load and store, with CXL.ioCXL carries three protocols on one link: CXL.io for device control, CXL.cache for coherent caching by a device, and CXL.mem for host access to device memory. for device discovery, CXL.mem for host access to device memory, and CXL.cache when a device caches host memory. The cards you actually pull from an E3.S bay are Type 3 memory expandersA CXL memory module is a Type 3 CXL device: a memory expander the host reaches over CXL.io and CXL.mem, without the CXL.cache link accelerators use., and they speak CXL.io plus CXL.mem. CXL 1.1 and 2.0 sit on the PCIe 5.0 PHY at 32GT/s. CXL 3.0 through 3.2 sit on the PCIe 6.0 PAM4 PHY at 64GT/s, and CXL 4.0 moves to 128GT/s.
CXL, the same bay with a different job
CXL and NVMe use the same wires and speak different protocols
Two stacks over one physical layer, in one kind of bay
Figure 1.9 shows what is shared and what is not. Below the protocol line the two are the same: lanes, signaling, link training and the bay. So a Gen6 slot in an Enterprise and Datacenter Standard Form Factor (EDSFF)EDSFF, the Enterprise and Datacenter Standard Form Factor, defines the E1.S, E1.L and E3 shapes built for dense, hot-swappable server storage. backplane can train either an NVMe SSD or a CXL memory module, and the slot does not tell you which one you installed. JEDEC JESD317-2 defines CXL memory modules (CMMs), and a SNIA form-factor deck lists them in the same EDSFF mechanicals as NVMe SSDs: Samsung’s CMM-D, for example, is an E3.S 2T module (two thickness) on a PCIe 5.0 x8 link. Hot swap can differ too, because some servers, such as Lenovo’s, document their E3.S CXL memory modules as non-hot-swap. The ThinkSystem SR650 V4 install procedure starts with powering off the server and disconnecting the power cords, and the SR860 V4 uses its E3.S bays for non-hot-swap memory modules.
One field mistake follows. An E3.S that seats in an NVMe backplane can be a Samsung CMM-D or Micron CZ120 class DRAM expander instead of a flash SSD. Samsung’s CMM-D 2.0 SKUs in that white paper are E3.S 2T, PCIe 5.0 x8, CXL 2.0 and DDR5. Micron’s CZ120 qualification note describes 128GB and 256GB modules in extra E3.S bays next to NVMe bays. NVMe Identify will not tell you what you expect, because the module is not an NVMe device. A platform CPU without CXL support won’t bring the module up as memory, and the module never appears as an NVMe namespace, so a missing namespace here isn’t an SSD firmware bug. Read the JEDEC CMM label for media type, CXL revision, capacity and connector width.
CXL today is mostly Type 3 DRAM capacity and bandwidth next to the CPU, for working sets that no longer fit in DIMMs. For most fleets that means memory expansion rather than a storage architecture. Part 10 covers pooling, sharing and when that changes. Don’t specify a CXL module as if it were an NVMe drive in the same skin. CXL traffic is memory access rather than a 4KB command completion, so it has no place on a block I/O comparison.
Form factors: how the package sets heat, power and service
A form factor defines the physical package, meaning its dimensions, connector, thermal environment and ecosystem. That package sets the thermal and mechanical environment a drive works in, whatever NAND and controller sit inside. Choosing it is a product and deployment decision with real engineering consequences. Client cards live in the PCI Express M.2 spec. Rack cards live in SNIA’s EDSFF overview. EDSFF skins also carry CXL memory modules, and the bay doesn’t advertise the protocol.
Form factors: how the package sets heat, power and service
Drawn on one scale, M.2 is the small card and E3.S is the large one
Footprints from the top, thicknesses from the side
Figure 1.10 draws the footprints and thicknesses on one scale. An M.2 cardM.2 is a small card format for SSDs. The name 2280 means 22mm wide and 80mm long, and other common lengths are 2230, 2242 and 22110. is 22mm wide at every length. E1.S is about as long as an M.2 22110 and wider. E3.S is the large card, about 76mm wide, and it comes in two thicknesses. Footprint decides how many NAND packages fit, and thickness decides the cooling path. The table below lists the same form factors with their connectors and typical use.
| Form factor | Dimensions | Connector | Typical use | Notable characteristic |
|---|---|---|---|---|
| M.2 2280 | 22 × 80mm | Edge connector (M key or B+M key) | Consumer, prosumer, laptop, desktop | Dominant client form factor, susceptible to thermal throttle in fanless slots |
| M.2 2230 | 22 × 30mm | Edge connector (M key) | Compact laptops, handheld devices | Same protocols as 2280, less NAND capacity due to the shorter board |
| U.2 | 2.5in, 7 or 15mm height | SFF-8639 | Enterprise hot-swap server bays | Power and data in one connector. A Gen6 product family can still come as a Gen5 U.2 |
| U.3 | 2.5in, 7 or 15mm height | SFF-8639 (same physical) | Hot-swap bays with mixed-protocol backplanes | Tri-mode. SFF-TA-1001 defines the pin usage and slot detection a host controller uses to pick the protocol |
| EDSFF E1.S | ~111.5 × 31.5mm | EDSFF connector | 1U front-access, hyperscale, Gen6 SI nodes | Cable-free hot swap, higher sustained power than M.2, three enclosure heights (9.5, 15 and 25mm) |
| EDSFF E3.S | ~112.75 × 76mm, 7.5mm (1T) or 16.8mm (2T) | EDSFF connector | High-capacity NVMe and CXL Type 3 memory | Same bay for a NAND SSD or a DRAM expander. Confirm the protocol before you chase NVMe logs |
| BGA | Board-level dimensions vary | Soldered, no connector | Laptops, tablets, embedded, automotive, industrial | Non-replaceable, no connector wear, vibration-resistant |
BGA (ball grid array) storage modules are soldered directly to the host board instead of connecting through a removable interface. That removes the connector, which cuts height and improves vibration resistance. BGA storage is common in thin laptops, tablets, mobile devices, industrial controllers and automotive applications where space and mechanical robustness matter more than replaceability. Much phone-class BGA storage runs on UFS, covered in the UFS guide. Apple’s phones are a documented case: AnandTech reported in 2015 that the iPhone 6s used PCIe and NVMe for storage instead of UFS or eMMC, and the Linux kernel carries an NVMe driver for Apple’s ANS controller. An early NVMe SSD in a single BGA package was Samsung’s PM971-NVMe, a 2016 PCIe SSD that was 1.5mm thick and held the controller, DRAM and the NAND dies for up to 512GB.
Serviceability is the trade-off. A BGA module cannot be upgraded or replaced without rework equipment. For consumer devices that is often acceptable. For industrial and automotive work it is frequently a requirement, because connector reliability over thousands of thermal cycles and years of vibration is hard to guarantee. That makes the solder joint the primary mechanical concern, addressed with reflow process control and thermal-cycling fatigue characterization under IPC-9701B. JEDEC’s JESD22 family is the environmental half of the same conversation.
M.2 as the client standard
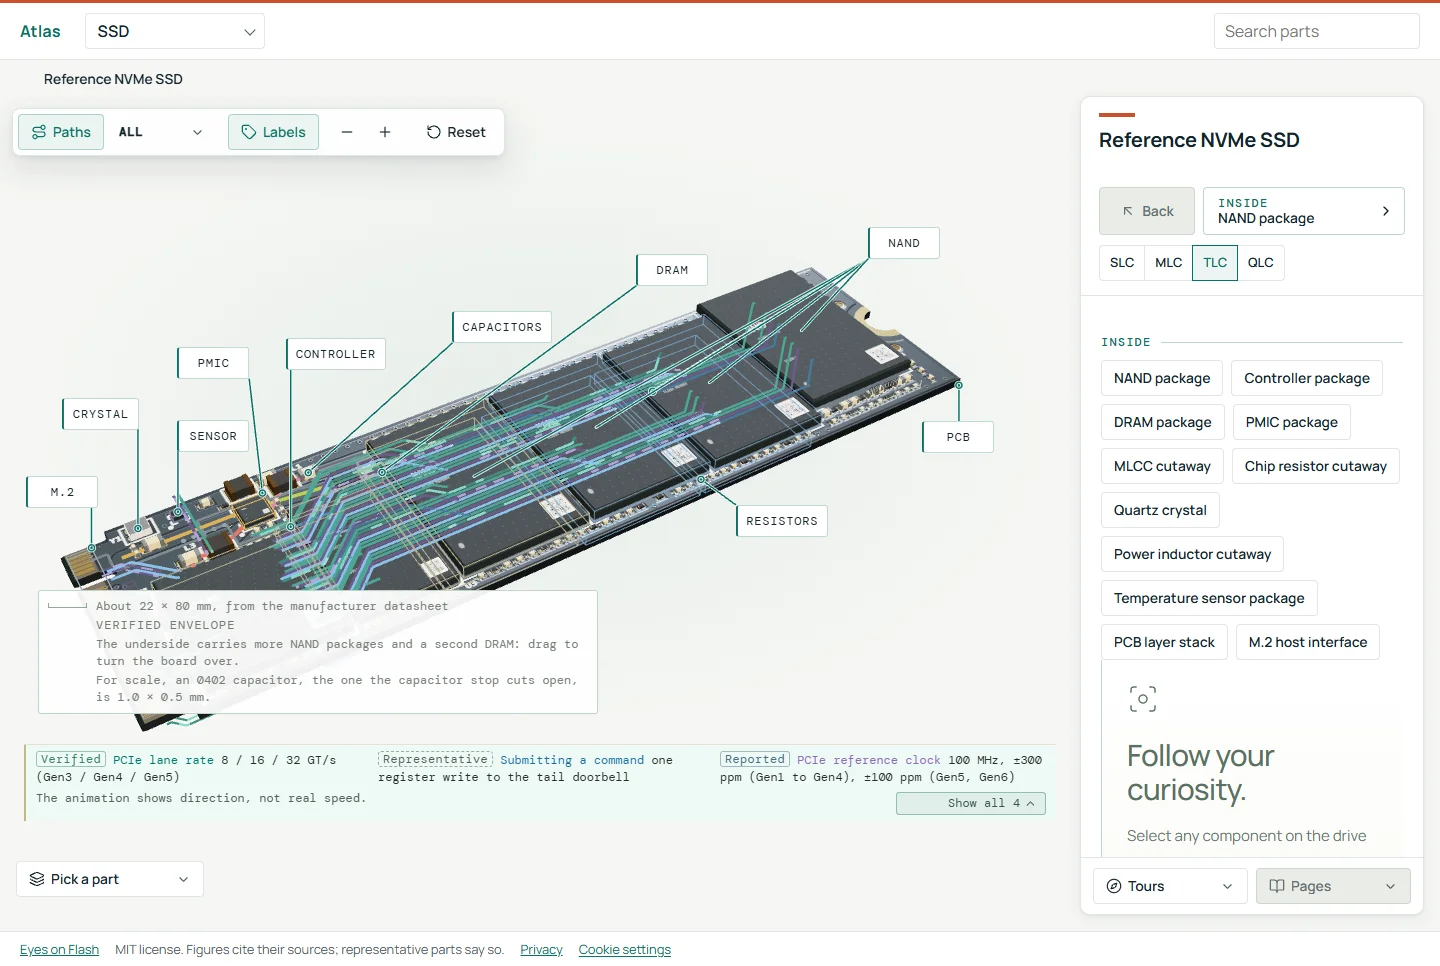
M.2 is the common form factor for client and prosumer SSDs. Each card is small and rectangular, with an edge connector. Length variants include 2230 (30mm, common in compact laptops and handhelds), 2242, 2260, 2280 (80mm, the desktop standard) and 22110 (110mm, used in some workstation and NAS platforms). Of the four or five digits, the first two are the width in millimeters and the rest are the length, so every standard M.2 SSD is 22mm wide. Height codes on the drive label set how tall parts can be on each side. D2 means double-sided, with components up to 1.35mm on each side, so a thin laptop that only takes single-sided drives will not fit a D2 card even when the length and key match. To see what sits on an M.2 card, open the Atlas, an interactive 3D reference for how an M.2 NVMe SSD is put together.
M.2 supports both SATA and NVMe over PCIe. Keying notches on the card edge say which socket a drive fits. They do not tell you whether the slot is wired for PCIe, SATA or both.
M.2 as the client standard
The notches on the card edge decide which sockets it fits
Schematic of the connector edge, not to scale
Figure 1.11 shows the two keyings in common use. An M-key card supports PCIe x4 and is what most NVMe M.2 drives use. A B+M-key card fits both B-key and M-key sockets and typically means SATA or PCIe x2. Check keying before you specify a drive. A wrong-keyed card either won’t fit or won’t be recognized.
Thermal management is the most important operational consideration for M.2 in compact platforms. A 2230 drive in a laptop slot with no heatsink and limited airflow will throttle sooner than the same drive tested open on a bench. Evaluating M.2 performance apart from the target platform produces numbers that do not reflect what a user will experience. To heat a simulated drive and watch the different ways real drives slow down, try the Throttle Lab.
Power delivery is the second compatibility issue. The 3.3V limitThe M.2 socket supplies 3.3V and sets a current limit that caps how much power the drive may draw from the board. comes from the M.2 specification. Through at least 2019 it was commonly quoted as 2.5A, or 8.25W, and a Flash Memory Summit talk on Gen4 thermals (Grace Chen of Phison) names 8.25W as the M.2 limit. The saved Plextor M9PG Plus and M9PGN Plus data sheets list 3.3V DC at 2.5A maximum. For scale, Micron’s 7450 data sheet lists its M.2 versions at a maximum average current of 2.4A (RMS) on the 3.3V rail, about 8W. That table also gives a typical peak inrush of 2.5A, a short surge as the drive powers up, which is a different quantity from the steady draw. A laptop can budget less than a drive like this draws at full speed, through NVMe power states and platform power policy, and the controller would then clock down. That is an inference and not a measurement here. A drive that posts full performance on a desktop testbench could throttle in the same laptop slot because the platform enforces a power budget, even with no heat problem. Without a power-rail measurement, the symptom looks identical to thermal throttle.
Gold fingers are the only electrical path off the module. An M-key card gets 3.3V power, up to four PCIe lanes, a reference clock and a handful of sideband signalsSideband pins carry control signals beside the data lanes, such as PERST# for reset, CLKREQ# for clock requests and PLN# for power loss notice. through them. A drive datasheet states the supply tolerance. One industrial M.2 datasheet specifies 3.3V ±5%, or 3.135 to 3.465V. Every watt of the power budget ends up as heat on a card 22mm wide, which is why fast drives lean on heatsinks and thermal throttling. Sideband signals, listed below, come from the same datasheet.
| Signal | Direction | What it does |
|---|---|---|
| REFCLK | Host to drive | 100MHz PCIe reference clock |
| PERST# | Host to drive | PCIe reset. Link training starts after the host releases it |
| CLKREQ# | Drive to host | Requests the reference clock. Also used by the L1 power-management substates |
| PEWAKE# | Drive to host | Open-drain wake request, with the pull-up on the platform side |
| SUSCLK | Host to drive | 32.768kHz low-power clock from the platform chipset |
| LED1# / DAS | Drive to host | Open-drain activity signal that drives an LED on the system side |
| SMBus (optional) | Both | Out-of-band management on platforms that wire it |
Two pins, MFG_DATA and MFG_CLOCK (pins 56 and 58), are reserved for SSD manufacturing and left unconnected in a host socket. A factory uses them to program and test a drive before it ever sees a host.
The rows also show what the drive doesn’t need. Because the host supplies SUSCLK, the drive needs no 32.768kHz crystal of its own. LED1# is only an output the drive pulls low, so the activity LED and its resistor sit on the host side. SMBus pins are 0/1.8V open-drain signals with the pull-up on the platform, and one NVMe M.2 2280 manual marks the device sleep (DEVSLP) pin not connected. M.2’s specification also defines PLN# (power loss notification) and PWRDIS (power disable), and revision 4.0 carries both. PLN# lets the host warn a drive that power is about to go, and PWRDIS lets the host cut power to it. PLN# first arrived through a 2018 engineering change notice to revision 1.1. SSSTC’s PLN page shows PLN# in use on its CA8 M.2 and PJ1 E1.S drives. Part 5 follows the 3.3V input past the connector to the rails inside the drive.
A drive can also train at fewer lanes or a lower generation than the slot offers, with no error. Checking is covered in the field section below.
U.2, U.3 and EDSFF: the server bays
Server bays trade the M.2 card’s small size for hot swap, power and cooling. U.2 and U.3U.2 and U.3 are 2.5-inch drive form factors with a PCIe connector. U.3 lets one backplane slot accept SAS, SATA or NVMe drives. keep the 2.5-inch drive shape. EDSFF drops it and is built for the rack. Figure 1.12 shows what each bay is built to take.
U.2, U.3 and EDSFF: the server bays
U.3 mixes drive protocols, and EDSFF bays can also hold memory
What each bay is built to accept
Only U.3 is built to mix drive protocols. EDSFF bays take NVMe SSDs and also CXL memory modules, which is why the bay never tells you what is installed. Measure the negotiated PCIe generation and read the module label before you read any logs.
U.2 uses the SFF-8639 connector and is the enterprise form factor for 2.5-inch SSDs. One connector carries PCIe x4 and power, and it supports hot swap and the high insertion counts data-center maintenance demands. U.2 drives look like 2.5-inch SATA or SAS drives and fit the same bays, which made the NVMe transition easier in many enterprise deployments. U.2 is also the easy place to get fooled on generation. A U.2 bay looks the same, but the link may not. Do not infer the PCIe generation from the product family name. SFF-TA-1001 is the universal x4 link definition on that same connector.
U.3 extends U.2 so one bay can accept a SATA, SAS or NVMe drive. This lets data center operators standardize on one physical form factor while supporting mixed protocol environments. Tri-mode lives in the host controller and backplane. Each drive still speaks one protocol, and the host detects the drive type at power-up and talks to it accordingly.
EDSFF was designed for the rack. It did not evolve from a laptop card. E1.S and E1.L sit in 1U with front-access hot swap, specified as SFF-TA-1006 and SFF-TA-1007. E3.S and E3.L are SFF-TA-1008. They are the larger family, meant to replace much of what U.2 used to do, with power envelopes that can run well past M.2. SNIA’s OCP EDSFF briefing is a useful public map of thickness versus recommended watts.
The Gen6 drives named in “What is on offer at these limits” below come in these bays rather than M.2: Micron’s 9650 in E1.S and E3.S, and Samsung’s PM1763. EDSFF offers cable-free hot swap and a thermal envelope that can hold a drive dissipating far more than M.2 allows, and E1.S is available for liquid cooling and comes in three heights (9.5, 15 and 25mm).
EDSFF drives such as Micron’s 7450 in E1.S take 12V instead of the M.2 card’s 3.3V, with a 3.3V auxiliary rail for management. A hot-plug bay also has to limit the inrush current that charges the drive’s input capacitance the moment it is inserted. OCP’s Catalina EDSFF reference design caps it at 2A. Enterprise drives handle this with inrush control or an eFuse on the input, and Intel listed inrush current management as a feature of its SATA DC S3700 enterprise drive.
In the field: proving a drive
Selecting standards, interfaces and form factors is the engineering on paper. Validation is where those decisions meet physical reality, and the field is where a missed limit shows up. Five checks cover most limit problems before anyone blames the firmware:
Negotiated link
Device Manager on Windows, or the LnkSta line in lspci -vv on Linux, shows the PCIe generation and width the drive trained at, and LnkCap shows the most it could train at. If LnkSta is lower, check the physical path first. A drive seated at an angle, dirty contacts or a riser with poor signal integrity can enumerate and still train at x2 or a lower generation. Cost-reduced boards sometimes route an M-key slot for only two lanes, or train the link below the drive’s generation. A drive takes whatever the slot offers with no error, and the user sees reduced bandwidth and no warning.
SATA speed
smartctl -i reports both the speed the drive supports and the speed currently negotiated.
NVMe revision
Read Identify Controller instead of the product page. Drives that look identical can report different NVMe versions and optional features.
Power versus heat
A drive that is fast on a bench and slow in a laptop slot may be hitting the platform power budget, so measure the 3.3V rail before concluding it is thermal.
What is in the bay
On an EDSFF backplane, read the module label before the logs, because an E3.S can be a CXL memory module that never appears as a namespace.
Those checks say what the drive could do. A test says what it does. Burst speeds are marketing and sustained speeds are reality, and that matters even more once a datasheet quotes Gen6 speeds. A factory-fresh drive has empty NAND, no GC pressure and a full SLC cacheAn SLC cache writes incoming data first in a fast one-bit-per-cell mode, then folds it into denser TLC or QLC cells when the drive has time.. That region is programmed one bit per cell for speed. Part 6 covers it. Testing that state tells you about the first burst and nothing about the second hour.
SNIA PTS fixes that with two preconditioning steps. Workload-independent preconditioning (WIPC) is two sequential full-drive fills. Workload-dependent preconditioning (WDPC) runs the target pattern until performance stabilizes. PTS calls a drive steady when, over a measurement window of five rounds, the range stays under 20% of the average and the best-fit slope stays within 10%.
In the field: proving a drive
Only the settled phase of a write test is a result
Write throughput during preconditioning, relative to the burst
Figure 1.13 shows why the order matters. It bursts first, drops through a transition and settles, and PTS records results only from the settled window. A burst figure from the fresh state is a starting point rather than a substitute, and Part 9 covers why sustained numbers differ.
PCI-SIG compliance, JEDEC SSD endurance and SNIA PTS are three different questions, and passing one doesn’t answer the other two. A compliance test confirms that a device meets the specification under the defined conditions. It says much less about real deployment. Real deployment adds temperature variation, connector wear, simultaneous I/O from multiple workloads and years of NAND wear.
Validation also has to cover the boundary conditions that define reliability over a product’s service life. These are power loss at critical I/O moments, sustained load at thermal limits, compatibility with the actual host platforms and operating systems, and behavior at the margins of the specification. ioTraX and similar live telemetry tools make I/O visible during these tests in ways static benchmarks can’t. Every performance and reliability claim in a datasheet needs a link to the test conditions, firmware revision and component lot that produced it. Without that chain a field failure cannot be traced back to the conditions that produced it.
JEDEC qualification proves that a component meets its specification in isolation, covering timing behavior and endurance under accelerated stress. Deployment validation proves that the assembled system behaves under real workloads, real thermals and real host stacks. A drive can pass every JEDEC qualification test and still fail on a specific platform, through marginal power delivery, a host driver that mishandles a power-state transition, or a thermal environment beyond what the form factor was designed for. SSD Benchmarking 101 is the measurement half of that argument.
What is on offer at these limits
As of October 6, 2026, Tom’s Hardware’s best-SSD guide recommends M.2 NVMe drives on PCIe 4.0 and 5.0 and lists no PCIe 6.0 consumer drive. The PCIe 6.0 SSDs in the sources below are data-center products in E1.S, E3.S or U.2 for SI servers. TrendForce’s March 2026 enterprise SSD readout has PCIe 5.0 as the mainstream enterprise interface this year, with the next contest being who can deliver stable Gen6 for SI. Micron exited the Crucial consumer channel after February 2026 to feed data-center customers. If you are buying or qualifying storage, start with the platform you actually have instead of the generation on a keynote slide.
Micron’s 9650 is a PCIe 6.0 data-center SSD in E1.S and E3.S, with up to 28GB/s sequential read claimed. Samsung’s PM1763 entered mass production in July 2026, claiming up to 28,400MB/s sequential read for its 16TB drive, and Storage Review’s write-up notes liquid-cooled, direct-to-chip server designs. Vendors made both claims, and neither is a preconditioned lab run. Samsung’s own PM1763 page still lists the U.2 SKU on Gen5, so check each SKU’s PCIe generation, because the family name alone doesn’t tell you.
NVMe’s public library is at 2.4, and EE Times’ briefing reports post-quantum crypto hooks, persistent lockdown, rate limiting and voltage-monitoring telemetry. These capabilities are optional, so a drive advertised as NVMe 2.4 doesn’t have to implement any of them, and its Identify data shows which it does.
What is on offer at these limits
Capacity ceilings run from 7.68TB (7450 PRO, E1.S) to 512TB (E2)
As of October 2026, log scale
Figure 1.14 shows the capacity steps of the drives and classes named here, with the form factor on each bar where the source gives one. The same Tom’s Hardware guide names the SanDisk Optimus GX Pro 8100 / WD Black SN8100 8TB as its best high-capacity (8TB) pick and the Samsung 9100 Pro 8TB as the alternative, both M.2 2280. Larger cards have been listed, such as a 16TB M.2 2280, the Exascend PE4, a PCIe 4.0 TLC drive.
Enterprise capacities come in their own steps, and for the 7450 the step tells you the endurance class. Micron’s 7450 is a clean example. Read-intensive 7450 PRO drives come in E1.S at 960GB, 1.92TB, 3.84TB and 7.68TB, and StorageReview’s launch coverage lists a 15.36TB U.3 step above that. Mixed-use 7450 MAX drives hold back more spare area and come in E1.S at 800GB, 1.6TB, 3.2TB and 6.4TB, and the same launch tables list U.3 versions up to 12.8TB. That missing space is overprovisioning, and Part 9 covers what it buys.
At the top end, Solidigm says it was first to introduce 30TB and then 60TB drives. Sandisk’s 2025 investor day deck shows the DC SN670, a 122.88TB drive built on quad-level cell (QLC) flash, which stores four bits per cell. Part 2 covers it. Drives in the 245 to 256TB class include the Micron 6600 ION, the Kioxia LC9 (245.76TB) and SK hynix PS1101 and the Sandisk UltraQLC (256TB). At FMS 2026 DapuStor showed the R6060, a 512TB drive in EDSFF E2.
ServeTheHome notes that E3.L and E1.L top out at 256TB (245.76TB), and DapuStor doubled that in the larger EDSFF E2 form factor. For scale, Sandisk builds its 256TB drive from 2Tb QLC dies, so one drive carries roughly a thousand of them. Part 3 explains why more dies also means more parallelism.
The limits every later part inherits
Because standards bodiesStandards bodies such as NVM Express, PCI-SIG, SATA-IO, JEDEC and ONFI each write the rules for one layer, from the host link down to the NAND bus. write these rules by layer, every later part uses this part’s vocabulary of protocol, link, package and body. The map below shows the two parts that build on it directly. Part 5 follows the 3.3V input and the NAND interface past the connector into the controller, and Part 9 takes the burst-versus-sustained gap into performance.
A quoted sequential figure from an empty E3.S in a liquid-cooled aisle doesn’t apply to a 2280 in a laptop slot, and it doesn’t make NAND tR faster.
The limits every later part inherits
Standards & Interfaces feeds 2 later parts.
Arrows run to the parts that build on this one.
Part 2 builds on this envelope from the other end. It covers how electrons are stored, how tightly they must sit in narrowing voltage windows, and why each program/erase cycle costs the cell measurable life. That physics is easier to read once you know the electrical and protocol limits the silicon has to live inside.
Sources
Primary is the original paper, standard or datasheet. Secondary is a review, a vendor summary or a news report. Measured is my own test data.
Show all 72 sources, 56 primary
- PrimaryJESD47F Stress-Test-Driven Qualification of Integrated Circuits (Revision of JESD47E, January 2007)JEDEC, 2007
- PrimarySerial ATA International Organization: Serial ATA Revision 2.6Serial ATA International Organization, 2007
- PrimarySamsung and Toshiba to Support New Standardized NAND Specification for High-performance ApplicationsToshiba/Samsung (hosted by KIOXIA), 2010
- PrimarySerial ATA Advanced Host Controller Interface (AHCI) 1.3.1Intel Corporation, 2012
- PrimarySolid State Storage (SSS) Performance Test Specification (PTS) EnterpriseSNIA, 2013
- PrimaryUnderstanding Performance of PCI Express Systems (WP350)AMD Xilinx, 2014
- PrimaryNAND Flash Interface InteroperabilityJEDEC Solid State Technology Association, 2016
- PrimarySamsung Mass Producing Industry’s First 512-Gigabyte NVMe SSD in a Single BGA Package for More Flexibility in Computing Device DesignSamsung Global Newsroom, 2016
- PrimaryNVMe PCIe SSD M.2 2280 Manual, PSFNP5xxxx5xxx Rev CViking Technology, 2019
- PrimaryAnswering Your Questions: NVMe-oF™ 1.1 Specification: Key Features and Use Cases Webcast - NVM ExpressNVM Express - scalable, efficient, and industry standard, 2020
- PrimaryNVM Express Announces the Rearchitected NVMe 2.0 Library of SpecificationsNVM Express, 2021
- PrimaryNVM Express Announces the Rearchitected NVMe® 2.0 Library of Specifications - NVM ExpressNVM Express - scalable, efficient, and industry standard, 2021
- PrimaryNVM Express Base Specification, Revision 2.0NVM Express, Inc., 2021
- PrimaryCompute Express Link 3.0 White PaperCXL Consortium, 2022
- PrimaryEDSFF Update: Industry Leaders Explain E1 and E3 Innovations and Specification UpdatesSNIA at Flash Memory Summit, 2022
- PrimaryNVM Express Base Specification, Revision 2.1NVM Express, Inc., 2024
- PrimarySandisk Investor Day 2025 deckSandisk, 2025
- PrimaryCMM02 Memory Module for Compute Express Link (JESD317-2)JEDEC, 2026
- PrimaryLenovo ThinkSystem SR650 V4: install an E3.S CXL memory moduleLenovo, 2026
- PrimaryLenovo ThinkSystem SR860 V4: server front view with E3.S 2T CMM baysLenovo, 2026
- PrimaryMicron 7450 SSD Series Technical Product SpecificationMicron Technology, 2026
- PrimaryNVM Express NVMe over TCP Transport Specification, Revision 1.3NVM Express, Inc., 2026
- PrimarySamsung Begins Mass Production of PM1763 SSD Optimized for Next-Generation AI InfrastructureSamsung Semiconductor, 2026
- PrimarySamsung CMM-D Utilization in IMDB ApplicationsSamsung Semiconductor, 2026
- PrimaryWhy does NVMe technology have lower latency than SATA or SAS? (NVM Express FAQ)NVM Express, 2026
- Primary24G SAS Data Storage Specification Development Complete; SCSI Trade Association Spotlights Technology at 2017 Flash Memory Summit | SNIASNIA
- PrimaryChanges in NVM Express Specifications
- PrimaryGlobal Top Five Enterprise SSD Vendors Post Over 50% QoQ Revenue Growth in 4Q25, with SK Group Leading Growth, Says TrendForceTrendForce
- PrimaryHighly Accelerated Temperature and Humidity Stress Test (HAST) (JEDEC)JEDEC
- PrimaryIntel SSD DC S3700 Series Product Specificationdownload.intel.com
- PrimaryJEDEC JESD230D: NAND Flash Interface InteroperabilityJEDEC
- PrimaryJEDEC Recently Published Documents (2026-10-07)JEDEC
- PrimaryKIOXIA Announces Industry’s First 245.76 TB NVMe SSD Built for the Demands of Generative AI EnvironmentsKIOXIA America, Inc.
- PrimaryLinux NVMe multipath — The Linux Kernel documentationdocs.kernel.org
- PrimaryMicron Announces Exit from Crucial Consumer BusinessMicron Technology
- PrimaryNVM Express Base Specification, Revision 1.4cNVM Express
- PrimaryOCP Catalina: PCIe Gen5 EDSFF NVMe SSD Reference Designs 1.0.1
- PrimaryOpen NAND Flash Interface Specification, Revision 6.0ONFI
- PrimaryPCI-SIG FAQ - PCI Express 4.0PCI-SIG
- PrimaryPCI-SIG FAQ - PCI Express 5.0PCI-SIG
- PrimaryPCI-SIG FAQ: PCI Express 6.0PCI-SIG
- PrimaryPlextor M9PG Plus data sheetNVMe
- PrimaryPlextor M9PGN Plus data sheetNVMe
- PrimarySamsung 870 EVO: data sheetSamsung Semiconductor
- PrimarySamsung 9100 PRO: data sheetSamsung Semiconductor
- PrimarySamsung NVMe SSD 970 EVO Plus Data Sheet, Revision 3.0Samsung Electronics
- PrimarySamsung NVMe SSD 990 PRO Data Sheet, Revision 1.0Samsung Electronics
- PrimarySamsung SSD 870 EVO Data Sheet, Revision 1.1Samsung Semiconductor
- PrimarySolid State Storage Performance Test Specification (PTS), Version 2.0.2SNIA
- PrimarySTA Forum, A SNIA Technology Community | SNIAsnia.org
- PrimaryStress-Test-Driven Qualification of Integrated Circuits (JESD47G)JEDEC
- PrimaryTemperature Cycling (JESD22-A104)JEDEC
- PrimaryThe PCIe 7.0 Specification, Version 1.0 is Now Available to MembersPCI-SIG
- PrimaryVibration, Variable Frequency (JEDEC)JEDEC
- PrimaryWhat is PLN(Power Loss Notification)? | SSD StabilitySolid State Storage Technology Corporation (SSSTC, A subsidiary of KIOXIA Corporation)
- PrimaryWhat’s the Difference Between JESD230G and Earlier JEDEC Standards?Electronic Design
- SecondaryThe Apple iPhone 6s and iPhone 6s Plus Review: System Performance and Storage (AnandTech, Wayback copy)AnandTech, 2015
- SecondaryEvolving Storage with SFF-TA-1001 (U.3) Universal Drive BaysStorageReview, 2018
- SecondaryNVMe Gen-4 Thermal Management: Too Hot To TouchFMS, 2019
- SecondaryLinux kernel drivers/nvme/host/apple.c (Apple ANS NVM Express host driver)Linux kernel (torvalds/linux), 2022
- SecondaryIntroduction to Compute Express Link (CXL) Memory ModulesSMART Modular Technologies, 2023
- SecondarySandisk unveils 256 TB SSD for AI workloads, shipping in 2026Blocks and Files, 2025
- SecondaryBest SSDs 2026: From blazing-fast M.2 NVMe down to budget SATATom's Hardware, 2026
- SecondaryGigantic DapuStor R6060 512TB E2 NVMe SSD Shown at FMS 2026ServeTheHome, 2026
- SecondaryNVMe 2.4 Update Adds Post-Quantum Security, Power ControlsEE Times, 2026
- SecondaryPCI Express M.2 specification revisions (PCI-SIG overview page)PCI-SIG, 2026
- SecondaryAll About M.2 SSDsFMS
- SecondaryBurn-in and HTOL Testing - Halbleiter.orghalbleiter.org
- SecondaryMicron 7450 SSD AnnouncedStorageReview
- SecondaryReliability testingTexas Instruments
- SecondarySNIA CMSS 2023: EDSFF April 2023 Panel UpdateSNIA
- SecondarySNIA CMSS 2024: The Latest on Form FactorsSNIA