Part 1 of SSD Benchmarking 101 built the test method, from locking down the host to preconditioning the drive and accounting for SLC cache behavior. Part 2 covered the synthetic tools that run on top of that method. Synthetics tell you what a controller can do under perfect conditions. This part asks what it actually does when applications are making the requests, because a review that skips that misses how the drive behaves in daily use.
Benchmarking 101
SSD Benchmarking 101, Part 3: Application and Trace-Based Tests
Move beyond synthetic scores with PCMark, 3DMark, Procyon, and hands-on tests that reveal how storage behaves under real applications.
On this page 38 sections
A synthetic test issues a single pattern of I/O (sequential reads at a fixed block size, random writes at a fixed queue depth) and measures the result in isolation. It is clean, controlled, and completely unlike anything your operating system will ever ask of the drive. Real applications mix read and write operations, alternate between sequential and random access, vary their block sizes mid-stream, and pause unpredictably while the CPU processes data between I/O calls. A drive that dominates CrystalDiskMark can stumble when Photoshop, Windows Search, and a file copy operation all hit the controller simultaneously.
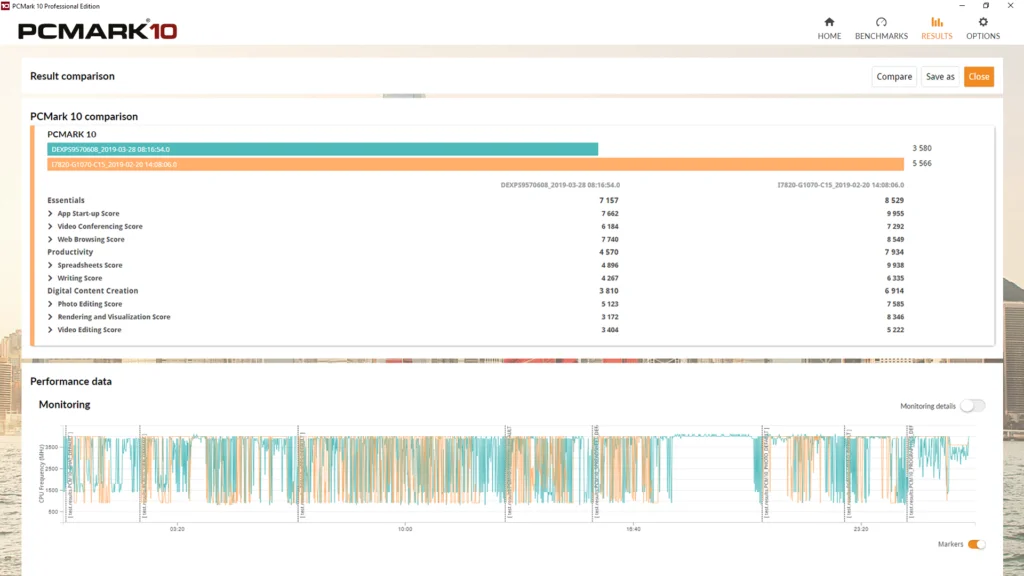
Trace-based testing captures that complexity. These tools record the actual storage I/O patterns generated by real applications, then replay those patterns against the drive under test. You get a benchmark that preserves the timing, the sequencing, and the mixed-workload chaos of genuine usage, and you do not have to install and manually run every application for every review.
Why traces matter
The gap between synthetic potential and real-world delivery is where consumer trust lives. When someone buys a fast Gen4 drive and their game loads barely faster than it did on their old SATA drive, the spec sheet failed them. In many games that is what happens. Traces expose that gap by testing the I/O patterns that actually determine user experience.
Why traces matter
A synthetic result and a game load sit far apart
For instance, a typical game load generates thousands of small random reads scattered across the drive’s address space, interspersed with occasional sequential bursts. Meanwhile the controller has to service these requests in real time while managing its internal FTL tables, handling garbage collection, and maintaining thermal discipline. Synthetic tools never create that pressure because they only test one dimension at a time.
| The Fundamental Principle: Synthetic benchmarks measure capability. Trace and application benchmarks measure behavior. A drive’s score in PCMark 10 and UL Procyon tells you more about the user experience than its CrystalDiskMark numbers ever will, because they test the patterns and workflows users actually generate. |
PCMark 10 storage benchmarks

UL’s PCMark 10 Storage suite is the closest thing this industry has to a standardized real-world SSD test. It replays I/O traces captured from genuine application sessions (booting Windows, launching Adobe Creative Suite, loading games, copying files) and measures bandwidth and access time across the entire sequence. Unlike a synthetic that hammers one metric, PCMark 10 forces the controller to handle the same unpredictable mix of operations that a real user generates in a real workday.
PCMark 10 storage benchmarks
PCMark 10 replays recorded sessions on the drive
The four benchmarks
PCMark 10 offers four storage benchmarks, each designed for a different evaluation scenario. Understanding which to run, and when, is critical to producing meaningful data.
The four benchmarks
The four PCMark 10 storage runs differ in length and purpose
| Benchmark | Traces | Duration (my planning estimate, varies by drive and rig) | Best For |
|---|---|---|---|
| Full System Drive | 23 traces, 3 passes each | ~45-90 minutes | Comprehensive review testing. The primary benchmark for every NVMe review on EyesOnFlash. |
| Quick System Drive | Subset of traces, fewer passes | ~15-20 minutes | Smaller drives or quick verification. Not suitable as a sole data point in a review. |
| Data Drive | File-oriented traces | ~10-15 minutes | NAS drives, USB storage, external SSDs. Tests storage behavior, not application performance. |
| Drive Performance Consistency | Heavy sustained workload | Several hours | Expert-level endurance testing. Reveals how performance degrades over time. |
What the traces actually test
UL’s PCMark 10 Technical Guide counts 23 traces in the Full System Drive benchmark. The main ones fall into five categories of real-world activity, and each category stresses the controller differently. Knowing what lives inside these categories helps you interpret results instead of just reporting a number.
What the traces actually test
Each trace category stresses the controller differently
Boot (boo)
Replays the I/O pattern of a full Windows boot sequence. Dominated by small random reads from scattered system files. Drives with poor QD1 random read latency will show it here first.
Creative applications (sacr, saft, sill, spre, slig, sps)
Launch and usage traces for Adobe Acrobat, After Effects, Illustrator, Premiere Pro, Lightroom, and Photoshop. These mix sequential reads of large project files with random writes for temp data and scratch disks, which makes them the heaviest traces in the suite.
Office (exc, pow)
These traces replay Microsoft Excel and PowerPoint usage. The I/O is lighter than the creative apps’ but sensitive to access time. Drives with high latency under mixed loads will score poorly here even if throughput is adequate.
Gaming (bf, cod, ow)
Game launch traces for Battlefield V, Call of Duty: Black Ops 4, and Overwatch. Heavily read-biased with burst patterns that stress the controller’s ability to service large sequential reads interrupted by random lookups.
File transfers (cp1, cp2, cp3)
ISO copy write, read-write copy, and read-only copy. They’re the traces most comparable to sustained sequential benchmarks, but with the realistic overhead of filesystem metadata operations layered on top.
Reading PCMark 10 results
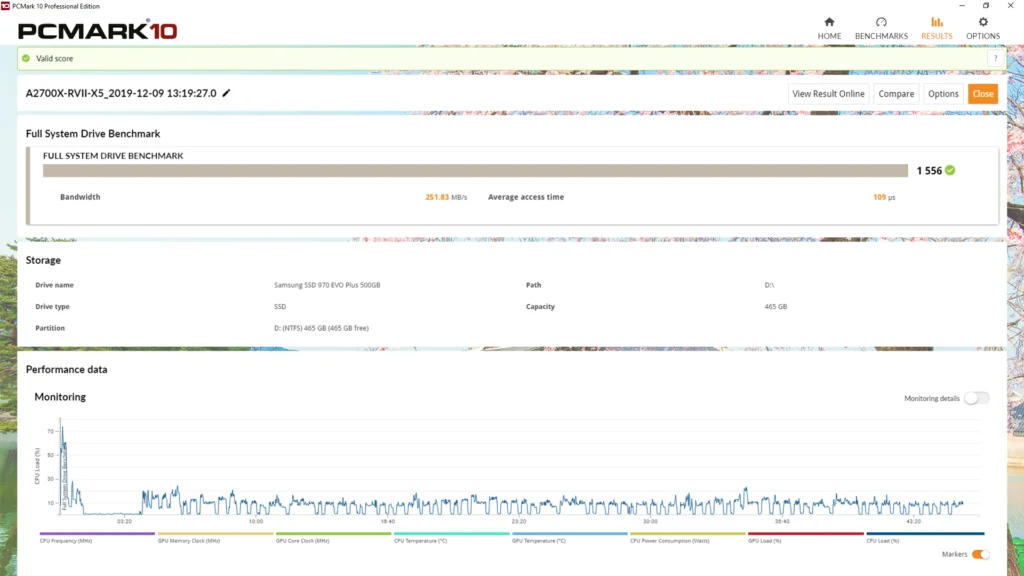
PCMark 10 produces three key metrics, an overall score, aggregate bandwidth in MB/s, and average access time in microseconds. PCMark’s overall score is a geometric mean of the bandwidth and access time sub-scores, weighted to reflect the relative impact of each on user experience. This weighting matters because a drive with excellent throughput but poor access time will score lower than you might expect, and that accurately reflects how sluggish it feels in practice.
Reading PCMark 10 results
Drive class sets the PCMark 10 Storage score
Full System Drive score on my bench; the SATA SSDs ran on an older AMD X570 rig
Overall score
Use this overall score for cross-drive comparison. On my bench, the median retail PCIe 4.0 drive scores about 3,170 and the median PCIe 3.0 drive about 2,070, across 64 and 20 drives. I’ve tested one Gen5 drive. It was an engineering sample and scored 4,915. SATA drives rarely pass 1,200: on an older AMD X570 rig, only one of my 14 SATA SSDs did (1,208), and their median was about 840. Two 20TB hard drives on the same rig as the NVMe drives scored 314 and 155.
Bandwidth
Aggregate throughput across all traces. Useful for understanding raw speed under mixed workloads, but should not be compared directly to synthetic sequential numbers, because the two measure fundamentally different things.
Average access time
Access time is the metric that most directly correlates with perceived responsiveness. Lower is better. My rule of thumb from daily use is that under 80 microseconds feels instant and over 150 microseconds feels slow. My 14 SATA SSDs averaged 144 to 248 microseconds, and the two hard drives 575 and 1,186.
| Configuration Note: PCMark 10 Professional Edition is required for review-grade testing. The free and Basic editions do not include the storage benchmarks. Run the Full System Drive test at minimum. If the review scope allows, run the Drive Performance Consistency test as well. It is the most revealing test in the entire suite, but it takes hours and writes terabytes. |
3DMark storage benchmark
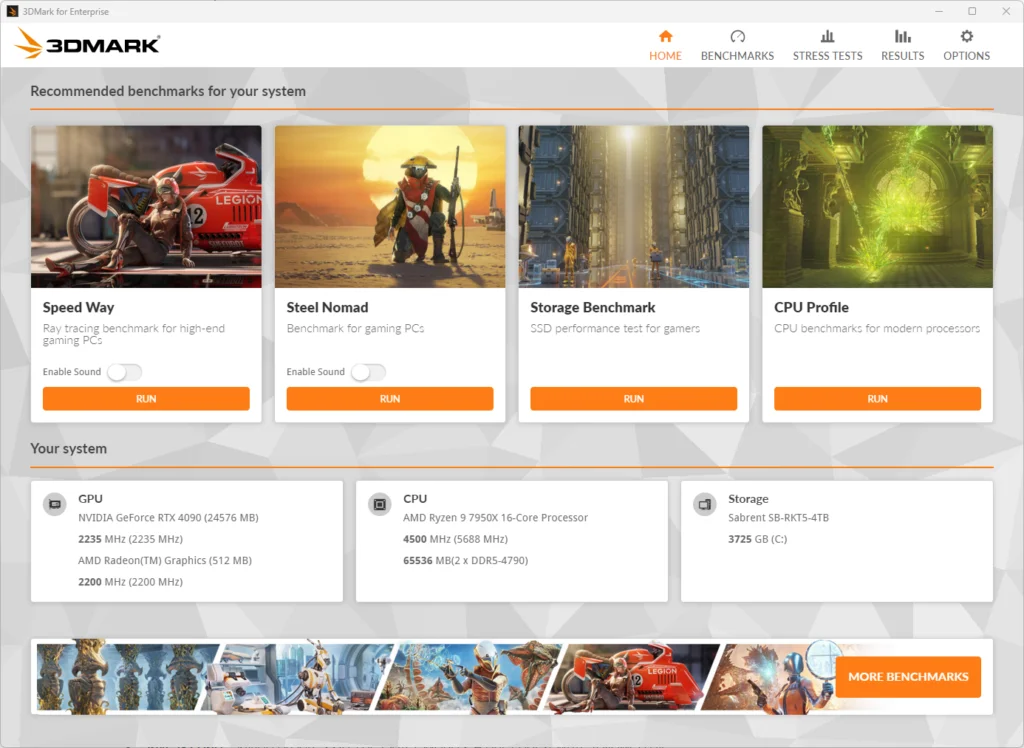
Where PCMark 10 covers the full spectrum of productivity, 3DMark’s Storage Benchmark narrows the lens to gaming. It uses traces recorded from real game launches, installations, save operations, and streaming captures to produce a single gaming-focused storage score. For a hardware reviewer covering consumer NVMe drives, this is the tool that answers the question readers actually care about most. Will this drive make my games load faster?
3DMark storage benchmark
3DMark narrows the traces to games and gives one score
The test scenarios
3DMark’s storage traces cover five scenarios that define the gaming storage experience:
The test scenarios
Five game scenarios mix reads and writes differently
Game loading
Launch-to-main-menu traces for Battlefield V, Call of Duty: Black Ops 4, and Overwatch. Expect read-heavy, random-dominant patterns that stress QD1 performance. That is the same metric that matters for OS snappiness.
Gameplay recording
A 1080p/60fps OBS recording trace captured during active Overwatch gameplay. It’s a simultaneous read-write workload that tests the controller’s ability to service game asset reads while absorbing a sustained video write stream.
Game installation
Epic Games Launcher installing The Outer Worlds. A sustained sequential write with filesystem metadata overhead. Reveals how the SLC cache behaves under a realistic large-write scenario.
Save and load
Saving progress in The Outer Worlds. A brief burst write followed by filesystem sync. Less demanding individually, but the latency of the sync operation separates fast drives from slow ones.
Game migration
Copying the CS:GO Steam folder from an external drive. A mixed sequential read-write that tests both interface throughput and the controller’s ability to handle large directory structures.
DirectStorage testing

3DMark also includes a DirectStorage feature test that benchmarks Microsoft’s GPU-accelerated storage decompression pipeline. This is forward-looking technology (only a handful of titles support it at the time of writing), but it demonstrates the theoretical bandwidth advantage of bypassing the CPU for game asset decompression. The test runs three stages, starting without DirectStorage, then with DirectStorage enabled, then with GPU decompression via GDeflate. Comparing the stages shows how much your specific SSD and GPU combination benefits from the technology.
DirectStorage testing
The DirectStorage test runs three stages
| Honest Assessment: DirectStorage scores are interesting for forward-looking analysis but should not be weighted heavily in current reviews. Game support remains limited, and in Forspoken’s DirectStorage benchmark a PCIe Gen5 drive finished seven scenes only about three seconds ahead of a PCIe Gen3 drive. Report it, contextualize it, but do not oversell it. |
Reading 3DMark storage results
3DMark produces a single overall score plus per-scenario bandwidth and access time breakdowns. Across the same drives, PCIe 4.0 models score a median of about 3,600 and PCIe 3.0 models about 2,640, and the Gen5 engineering sample scored 5,129. The per-scenario breakdown is where the editorial value lives. A drive might post a competitive overall score but lag in the gameplay recording trace, revealing a controller that struggles with simultaneous read-write operations.
Reading 3DMark storage results
3DMark Storage scores rise with drive generation
Same drives as the PCMark 10 chart; the Gen5 drive is one engineering sample
UL Procyon benchmarks

PCMark 10 and 3DMark replay I/O traces (recordings of what applications asked the storage subsystem to do). Procyon takes the next step and runs the actual applications. UL’s Procyon suite launches real instances of Adobe Lightroom Classic, Photoshop, and Premiere Pro, executes standardized workflows through them, and scores the system based on how quickly those workflows complete. The difference matters because trace replay isolates storage performance while Procyon measures the entire pipeline, with CPU decode, GPU acceleration, memory bandwidth, and storage I/O working together the way they do on your reader’s actual machine.
UL Procyon benchmarks
Procyon times the whole pipeline, not storage alone
That makes Procyon less useful as a pure storage benchmark and more useful as a system-level validation tool. A drive might post identical PCMark 10 storage scores to a competitor but deliver noticeably different Procyon Photo Editing results because Lightroom’s catalog import behavior stresses the controller’s mixed I/O handling in ways that PCMark’s traces do not capture. Together the two tools complement each other. PCMark tells you how the storage behaves in isolation, and Procyon tells you how it behaves when the rest of the system is competing for the same resources.
The relevant benchmarks
Procyon offers several benchmarks, but three are directly relevant to storage review methodology:
The relevant benchmarks
Each Procyon benchmark leans on storage in a different phase
Photo Editing
Imports DNG files into Lightroom Classic, applies presets, crops, and modifies images, then moves to Photoshop for layer effects and retouching. Storage-sensitive during the import phase, where the drive must handle thousands of small file reads while Lightroom builds its catalog database. Drives with strong QD1 random read performance and low access time show their advantage here.
Video Editing
Imports two project files into Premiere Pro, applies edits, adjustments, and GPU-accelerated effects, then exports in both H.264 (1080p) and H.265 (4K UHD). The export phase is where storage matters most, because Premiere writes to the scratch disk while reading source assets simultaneously, creating the mixed sequential-random pattern that separates fast controllers from overwhelmed ones.
Office Productivity
Runs Microsoft Word, Excel, PowerPoint, and Outlook through standardized tasks. Less storage-intensive than the creative benchmarks but useful as a baseline for general responsiveness, and for reviews targeting business or enterprise buyers who care about Office performance.
Procyon vs. PCMark 10
I treat Procyon as the newer tool because PCMark’s traces were captured years ago from applications that have since been updated, while Procyon runs current software versions every time. But for storage-specific analysis, PCMark 10’s isolation of the I/O layer remains more diagnostically useful. My recommendation is to run both. Use PCMark 10 for cross-drive storage comparison where you need to control for CPU and GPU differences. Use Procyon to validate that storage performance translates into real application speed on the actual test platform.
Procyon vs. PCMark 10
Run both PCMark 10 and Procyon, for different jobs
Manual real-world testing
Trace replay is powerful, but it has a blind spot. The traces were recorded on specific hardware, with specific filesystem configurations, at a specific point in time. They cannot account for how a drive behaves with your readers’ actual workloads on current software versions. That is where manual real-world tests come in. These are controlled, repeatable file operations that you execute yourself, timed with precision, on the actual drive under review.
Manual real-world testing
A trace is a snapshot, a manual test runs today
The file transfer gauntlet
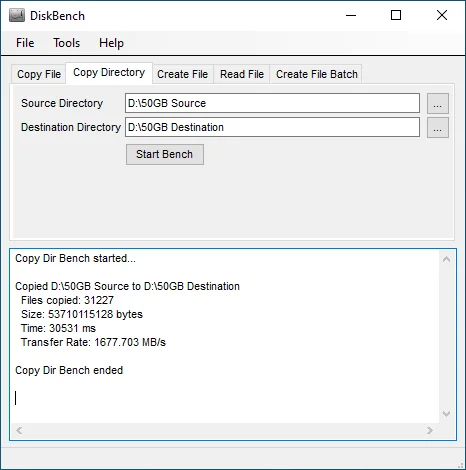
This is the test that exposes SLC cache behavior more honestly than any synthetic ever will. In practice the procedure is straightforward. Transfer a known dataset from a fast secondary drive to the DUT, timed from the first byte to the last. Run transfers that exceed the SLC cache capacity so you capture both the burst speed and the post-cache cliff.
The file transfer gauntlet
Transfers that outrun the SLC cache show the cliff
| Transfer | Dataset | What It Reveals |
|---|---|---|
| Small Burst | 10 GB single ISO file | Peak sequential write from SLC cache. Should match or approach rated spec. |
| Cache Exhaustion | 100–200 GB mixed files (ISOs + folders) | The point where SLC cache runs out and throughput drops to native TLC/QLC speed. |
| Large Sustained | Full SLC cache capacity + 50% | Post-cache write speed and controller behavior under sustained load. This is the number that matters for content creators. |
| Small File Storm | 50,000+ files under 1 MB each | Random write IOPS in a real filesystem context. Brutally exposes weak controllers. |
Source drive
Your source must be faster than the DUT so that the drive under test is always the bottleneck. A RAM disk is ideal if you have the memory. A secondary Gen5 NVMe works for testing Gen4 and below.
Filesystem
NTFS for Windows testing. Always format with default allocation unit size unless you are specifically testing the impact of cluster size on performance.
Timing
Time the copy with a stopwatch or scripted timer and ignore the Windows copy dialog’s estimate, which lies. It averages, it rounds, and it includes filesystem overhead inconsistently.
| The Content Creator Test: For reviews targeting creative professionals, add a dedicated Premiere Pro export test: export a standardized 5-minute 4K timeline to H.264 and H.265, timed from render start to completion. The scratch disk behavior during export reveals controller performance under the mixed sequential-random patterns that video editing generates. This is one of the few tests where SLC cache size directly impacts completion time for a real workflow. |
Game load timing
Game load tests are the most reader-relevant benchmark you can run, and they are also the most humbling. Past a point, extra sequential speed buys little. In my testing, the typical PCIe 4.0 drive reads 99% faster sequentially than the typical PCIe 3.0 drive but moves only 30% more data on 3DMark’s Battlefield V loading trace. Flagship PCIe drives load games only marginally faster than older ones, despite far higher sequential throughput. DirectStorage goes after a different part of the load, handing asset decompression to the GPU.
Game load timing
99% faster sequential reads move only 30% more game-load data
Typical PCIe 4.0 drive against typical PCIe 3.0 drive, on my bench
That said, the test is still worth running because it grounds the entire review in the metric readers care about most. Standardize on three to five titles with known heavy load sequences, time from click to playable state, and run each measurement five times to report the median. Run-to-run variance is as informative as the absolute number, because a drive with inconsistent load times is telling you something about its firmware’s resource allocation under mixed I/O pressure.
Recommended titles
Choose games with notoriously long or asset-heavy load sequences. At the time of writing, titles like Cyberpunk 2077, Baldur’s Gate 3, and Starfield provide meaningful differentiation, and the list should rotate as new releases arrive.
DirectStorage titles
When available, include at least one DirectStorage-enabled game to track real-world adoption of GPU-accelerated loading. Compare it against non-DirectStorage titles, because that delta is the story.
Trace and real-world summary
Synthetic benchmarks earn their place by providing controlled, repeatable data points. But trace-based and real-world tests earn reader trust by answering the questions people actually ask. How fast will this drive load my games? How long will a 200 GB file transfer take? What happens when the SLC cache runs out?
Trace and real-world summary
Six tests fall into three groups
| Test | Type | Primary Value | When to Use |
|---|---|---|---|
| PCMark 10 Full System | Trace replay | Comprehensive mixed-workload scoring with access time measurement | Every review. Non-negotiable. |
| PCMark 10 Consistency | Trace replay (extended) | Long-duration degradation analysis | Deep dives and endurance-focused reviews |
| 3DMark Storage | Trace replay (gaming) | Gaming-specific loading and installation scoring | Every consumer NVMe review |
| UL Procyon Photo/Video | Live application | Real Adobe workflow performance, system-level validation | Creative-focused reviews and system-level comparisons |
| File Transfer Gauntlet | Manual | SLC cache size, post-cache speed, sustained throughput | Every review. Especially QLC and budget TLC drives. |
| Game Load Timing | Manual | Reader-relevant load time comparison | Every consumer review. Ground truth for marketing claims. |
Bridging to advanced I/O
The tools in this section reveal how a drive behaves under real-world conditions, from PCMark’s trace replay to Procyon’s live application execution to the manual transfers that expose cache behavior with a stopwatch and a dataset. But they all operate within the constraints of predefined workflows and standardized file operations. When you need to craft a custom I/O pattern (specific queue depths, specific block sizes, specific read-write ratios running for specific durations), you need a different class of tool, such as fio, iometer, StorScore, and diskspd. These are the instruments that let you design the experiment instead of replaying someone else’s.
Bridging to advanced I/O
Custom I/O tools let you set the pattern yourself
Sources
Primary is the original paper, standard or datasheet. Secondary is a review, a vendor summary or a news report. Measured is my own test data.
Show all 5 sources, 2 primary
- PrimaryPCMark 10 Technical GuideUL, 2020
- PrimaryWe tested the impact of SSD speed on gaming performance in 11 titles — we analyzed from SATA to PCIe 5.0 to see whether upgrading to a faster NVMe SSD would have an impactTom, 2026
- SecondaryDirectStorage Testing Shows PCIe 3 SSDs Are Basically as Fast as PCIe 5Tom, 2023
- SecondaryThe State of Microsoft DirectStoragecorsair.com
- MeasuredThe author’s own measurements