In the early days of NVMe, the industry was more frontier than ecosystem. Every manufacturer raced to outdo the next with sequential read speeds and marketing slides that promised “record-breaking performance.” Those numbers often crumbled once the drives left the lab and entered sustained use. That gap is what my torture tests go after.
Lab Notes
The “Torture Test” Architect
How I test sustained writes, cache recovery and heat, and why a short benchmark can hide what a long one shows.
On this page 2 sections
Here is how I run the long test. It is a sustained write that runs until the cache is gone, with idle gaps to show what comes back and a separate log for heat.
Why I run the long test
A short benchmark shows a drive at its best, and a long one shows what you are actually buying. That is why every review I write includes a sustained write test that runs until the drive has used up its cache.
I use Iometer to write sequentially for 15 minutes, then measure two things, how much data the drive absorbs at full speed, and how fast it writes once the cache is full. Between rounds I leave idle gaps to see how much cache the drive recovers. All three results below come from my Tom’s Hardware reviews, one review for each drive.
Results differ more than spec sheets suggest. My 1TB Kingston KC3000 sample absorbed 369GB at 6,050MB/s before dropping to about 1,015MB/s. The WD Blue SN570 filled a cache of only 12-13GB and fell to about 615MB/s. The Seagate IronWolf 525 absorbed 70GB, dropped from roughly 4.4GB/s to 990MB/s, and on later passes took about 175GB before slowing, recovering that space in roughly five minutes of idle time.
Why I run the long test
The same long write test finds very different caches
Data each drive absorbed at full speed before slowing
Lined up on one scale in the first figure, the KC3000 bar runs far past the other two. Each bar is one drive from my own bench. Beside it the SN570 bar is barely visible. Its later-pass figure sits as a dashed mark on the IronWolf row, after it had recovered cache during idle time. Flash Foundations Part 9 explains why a cache makes burst numbers look so good.
Others run benchmarks that show perfect bursts on empty drives. My runs are dirty, hot and under constant pressure, so the drive is already in use, the heat is logged and the load doesn’t let up. I judge a drive by its steady-state performance rather than by a headline IOPS figure, and my test rigs aren’t built to flatter a drive.

Sustained writing is one test among several, and the regression test frameworks I build simulate client and enterprise workloads, with mixed random writes, continuous queue depth transitions, thermal throttling scenarios and sustained read-disturb conditions. Pushing a drive until its thermal controller starts cutting speed is part of that. Each test is meant to fail a drive in a way I can learn from. Endurance, thermal integrity and consistency matter more to me than glamour metrics, so a drive that gets through my scripts has shown it holds the performance on its datasheet.
Heat is part of the test
I record the room temperature, whether there is any airflow, and how much data it takes to trigger throttling. The IronWolf 525 began to throttle after roughly 500GB of writes, at 83°C. The KC3000 reported 71°C after about 500GB of transfers, and that is when it engaged its thermal throttle.
Heat is part of the test
A heat run logs three notes, then watches for the throttle
Sketch of one run, no values
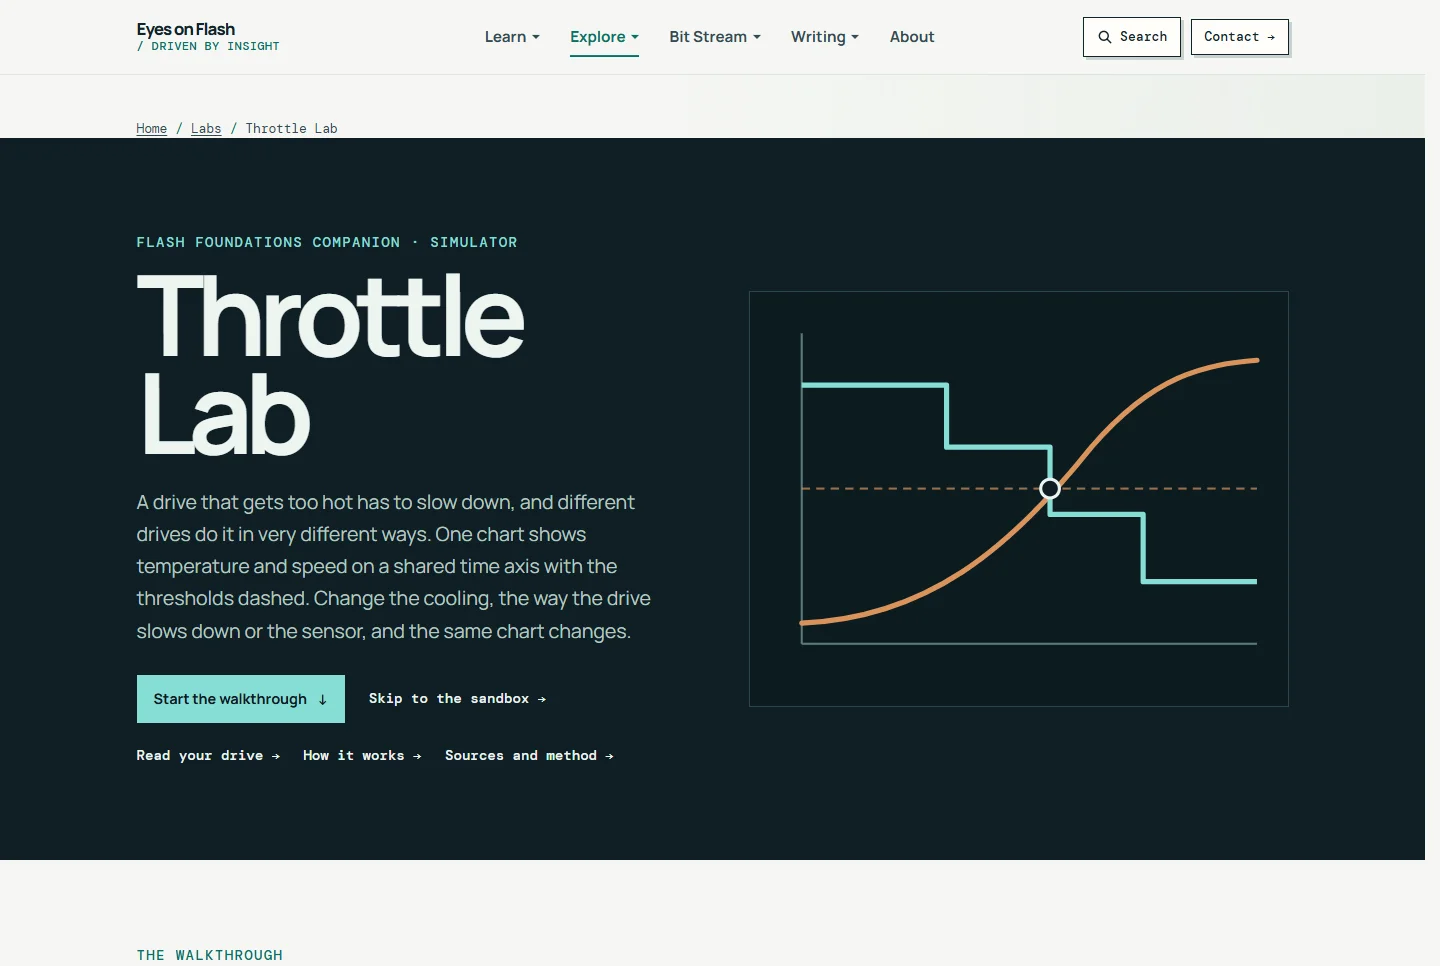
Each run gets a log so one run can be compared with another. Room and airflow set how soon a drive gets there, so the three notes, room temperature, airflow and data written, go with every result. In the Throttle Lab you can heat a simulated SSD and watch the different ways real drives throttle.

None of this makes a drive good or bad. It tells you which workload it suits. In my view a gaming drive can live with a cache as small as the SN570’s 12-13GB, while a drive that copies hundreds of gigabytes a day cannot. My SSD Benchmarking 101 guide covers how to set up these tests so the results mean something.
Sources
Primary is the original paper, standard or datasheet. Secondary is a review, a vendor summary or a news report. Measured is my own test data.
Show all 1 sources
- MeasuredThe author’s own measurements