Part 1 of Benchmarking 101 set the method. Lock down the host, precondition the drive, respect the SLC cache, and know what queue depth, block size and data pattern each do to a result. Part 2 puts that method to work on the synthetic tools most reviewers open first. Each one measures a different slice of drive behavior, and each hides a few settings that move the numbers. This part covers what each of six tools measures and shows, and gives formal test settings for CrystalDiskMark and ATTO. Part 3 then moves on to trace-based and real-world tests.
Benchmarking 101
SSD Benchmarking 101, Part 2: Synthetic Benchmark Tools
Use CrystalDiskMark, ATTO, AS SSD, and other synthetic tools with a clear understanding of their settings, results, and limitations.
On this page 27 sections
Synthetic benchmarks are the controlled laboratory tests of the storage world. They do not replicate real-world usage, and they are not meant to. Their value is precision and repeatability, since they isolate specific performance dimensions so you can compare drives under identical conditions. CrystalDiskMark, ATTO, AS SSD and Anvil form the backbone of consumer storage verification, and every serious review should include all four.
CrystalDiskMark (CDM)
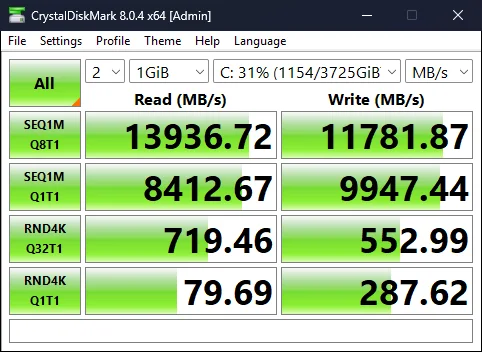
CrystalDiskMark is the industry standard for what I call “hero numbers.” It is the tool I reach for first to check a spec sheet claim. If a Gen4 drive claims 7,000 MB/s sequential reads and CDM shows 5,200, you have either a configuration problem or a misstated spec sheet.
CrystalDiskMark (CDM)
CDM reports four test profiles, each with a read and a write
CrystalDiskMark configuration
CDM’s default settings are adequate for casual checks but insufficient for review-grade data. The following configuration should be used for all formal testing:
CrystalDiskMark configuration
A 1 GiB test fits in the SLC cache and a 32 GiB test does not
| Setting | Value | Rationale |
|---|---|---|
| Mode | NVMe (or default for SATA) | Ensures the correct I/O path is used for the interface type |
| Test Size | 1 GiB (cache), then 32 GiB (NAND) | 1 GiB fits inside most SLC caches; 32 GiB exceeds them and reveals raw NAND speed |
| Passes | 5 | Averaging across five passes smooths out minor OS scheduling noise |
| Data Pattern | Default (random) | CDM uses incompressible random data by default, which is correct for honest testing |
Reading CDM results
CDM outputs eight metrics across four test profiles. Here is what each row actually tells you and why it matters:
| CDM Row | What It Tests | Real-World Relevance |
|---|---|---|
| SEQ1M Q8T1 | Peak sequential throughput at high queue depth | Large file transfers when the drive is under sustained, heavy load. This is the marketing number. |
| SEQ1M Q1T1 | Sequential throughput at low queue depth | Large file copies under typical single-threaded workloads. Closer to what users actually experience. |
| RND4K Q32T1 | Random 4K at high queue depth | Database and server workloads. Rarely relevant for consumer use but shows controller capability. |
| RND4K Q1T1 | Random 4K at queue depth 1 | OS boot, app launches, game loading. The single most important number for perceived system responsiveness. |
Reading CDM results
Access pattern and queue depth place each CDM row on a map
Additionally, you can sort through the results and view them individually as IOPS, latency, or in GBps instead of MBps if you’re playing with fast flash.
ATTO
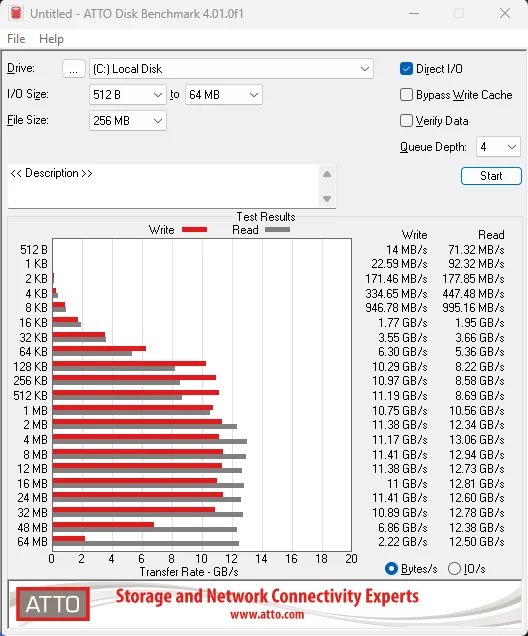
Where CDM gives you snapshots at fixed block sizes, ATTO gives you the full picture. In my run above, the sweep covers I/O sizes from 512 B to 64 MB and plots throughput at each step. This produces a characteristic “ramp-up curve” that reveals how the controller handles different I/O granularities.
ATTO
ATTO sweeps from small transfer sizes to large and plots each step
Why ATTO matters
ATTO answers a question CDM cannot: at what block size does this drive reach peak performance? Throughput climbs with transfer size and then levels off, and the size where it levels off differs from one controller and firmware to the next. If the ramp-up curve is jagged or inconsistent, the controller is likely struggling with internal garbage collection or FTL inefficiency at those intermediate sizes.
Why ATTO matters
The size where the curve levels off differs between drives
ATTO configuration
Transfer size range
My run above covers 512 B to 64 MB. Keep the whole range, because the small sizes at the low end are where controller weaknesses show up.
ATTO configuration
Three ATTO settings shape the sweep
Total test length
Use 256 MB at minimum, as in my run above; larger values (1–4 GB) improve consistency but increase test time.
Queue depth
Use a queue depth of 4, as in my run above, which is enough to show controller scaling without entering enterprise territory.
Reading the curve
A healthy NVMe drive shows a smooth, steep ramp through the small transfer sizes, then a flat plateau at or near rated speed. Look for these warning signs in the ATTO output:
Reading the curve
A healthy ramp is smooth and steep, then flat
Late plateau
If the drive reaches peak speed only at much larger transfers than similar drives do, the controller may be struggling to coalesce small I/O.
Jagged curve
When throughput swings up and down between adjacent transfer sizes, suspect firmware instability or aggressive background garbage collection.
Write dips
Sudden drops in write throughput at specific block sizes can indicate SLC cache boundary effects or FTL mapping inefficiencies.
AS SSD
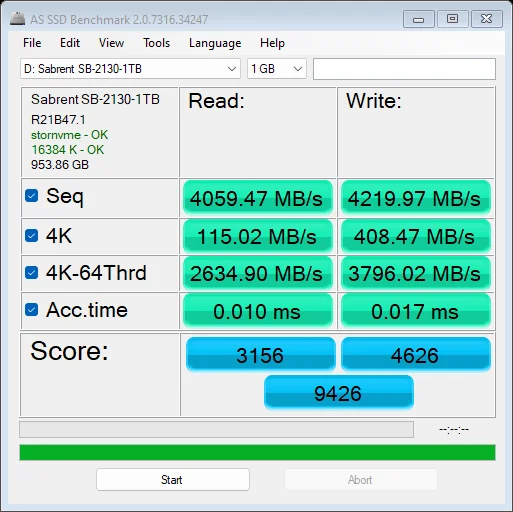
AS SSD is the hard truth of consumer synthetic testing. Unlike CDM, whose test data can be switched from random to all zeros, the standard AS SSD run shown above (sequential, 4K, 4K with 64 threads, and access time) uses incompressible data. This means compression-equipped controllers get no help in that run. Its speeds are the ones to expect with data that does not compress, like encrypted volumes.
AS SSD
AS SSD's standard run sends incompressible data
Unique value: access time
AS SSD provides a metric that no other consumer tool does well, which is read and write access time in milliseconds. This is a direct measurement of the controller’s reaction time to a new I/O request, completely independent of throughput. A drive can have excellent sequential speeds but poor access time if its controller firmware has high per-request overhead.
Unique value: access time
One 1 TB drive's access times sit well under the NVMe limit
Good read access time
A good result is under 0.05 ms for NVMe and under 0.1 ms for SATA, which indicates a responsive controller with efficient command processing.
Concerning read access time
Above 0.1 ms for NVMe suggests firmware overhead, thermal throttling, or a controller that deprioritizes latency in favor of throughput.
The copy benchmark
AS SSD also includes a three-pattern copy benchmark that simulates transferring an ISO image, a program folder, and a game folder, using fixed file mixes that stress the controller with varying file sizes and counts simultaneously, bridging the gap between pure synthetic and trace-based testing.
The copy benchmark
AS SSD copies three file mixes that stress the controller differently
Anvil
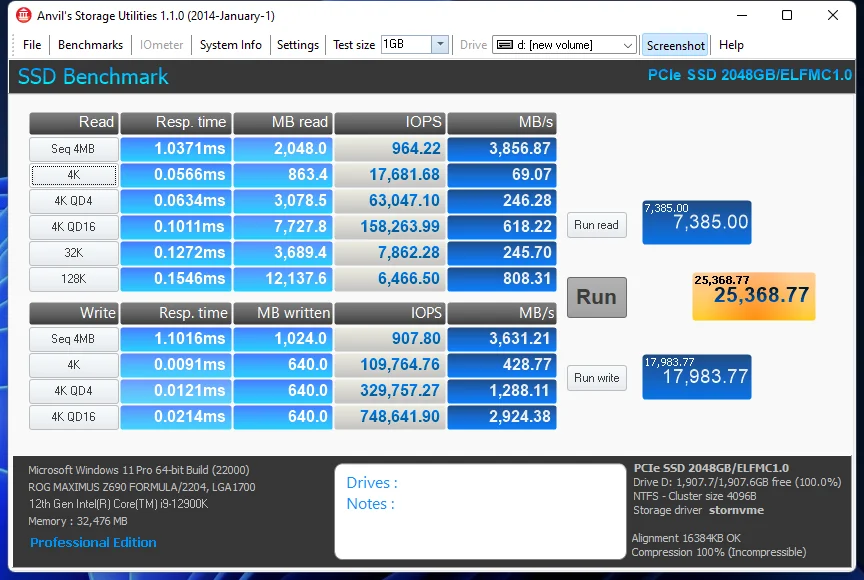
Anvil sits between consumer synthetics and heavier I/O analysis. Where CDM runs each profile at a single queue depth, and AS SSD adds one 4K row with 64 threads, Anvil runs its 4K tests at several queue depths in a single pass (4K, 4K QD4 and 4K QD16 in the result above), reporting both IOPS and response time at each level. This shows how a drive scales under increasing parallelism.
Anvil
Anvil measures how IOPS scale as the queue deepens
Key metrics
IOPS scaling
A well-designed controller should keep gaining IOPS from QD1 through QD16, though each step gains less than the depth grows. In the result above, 4K reads and writes both rise at every step. If IOPS flatten or decline at higher queue depths, the controller is saturated.
Key metrics
Anvil reads IOPS, response time and read-write asymmetry
Response time
Anvil reports average response time per QD level. Watch for steep increases at the deepest queues, which indicate the controller is queuing requests faster than it can service them.
Read vs. write asymmetry
Compare read and write IOPS at each QD level. Large asymmetries can reveal controller design priorities and NAND page programming characteristics.
| When to Use Anvil: Anvil fills the gap between CDM’s snapshot approach and a custom fio job file. Use it when you need QD-scaling data but do not need that granular control. |
KDiskMark
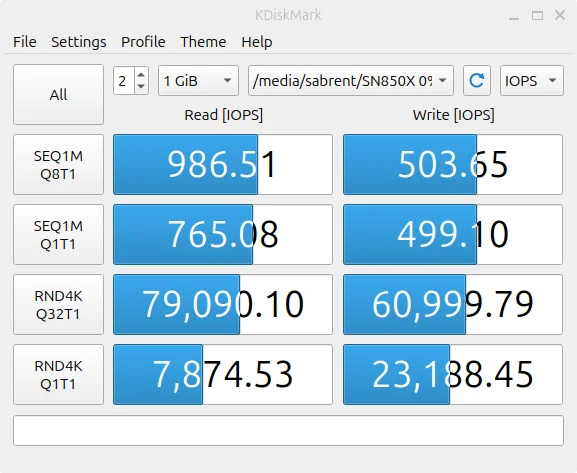
KDiskMark is the Linux equivalent of CrystalDiskMark, delivering snapshot benchmarks for SEQ1M and RND4K read/write speeds across configurable queue depths and threads, using fio under the hood.
KDiskMark
KDiskMark runs fio, so Linux filesystem and scheduler effects show
It uncovers Linux-specific quirks like filesystem overhead or scheduler impacts that Windows tools miss, enabling cross-OS drive comparisons. Profiles like NVMe SSD presets optimize block sizes for controller stress-testing, with exportable reports for sharing precise IOPS and latency data.
AmorphousDiskMark
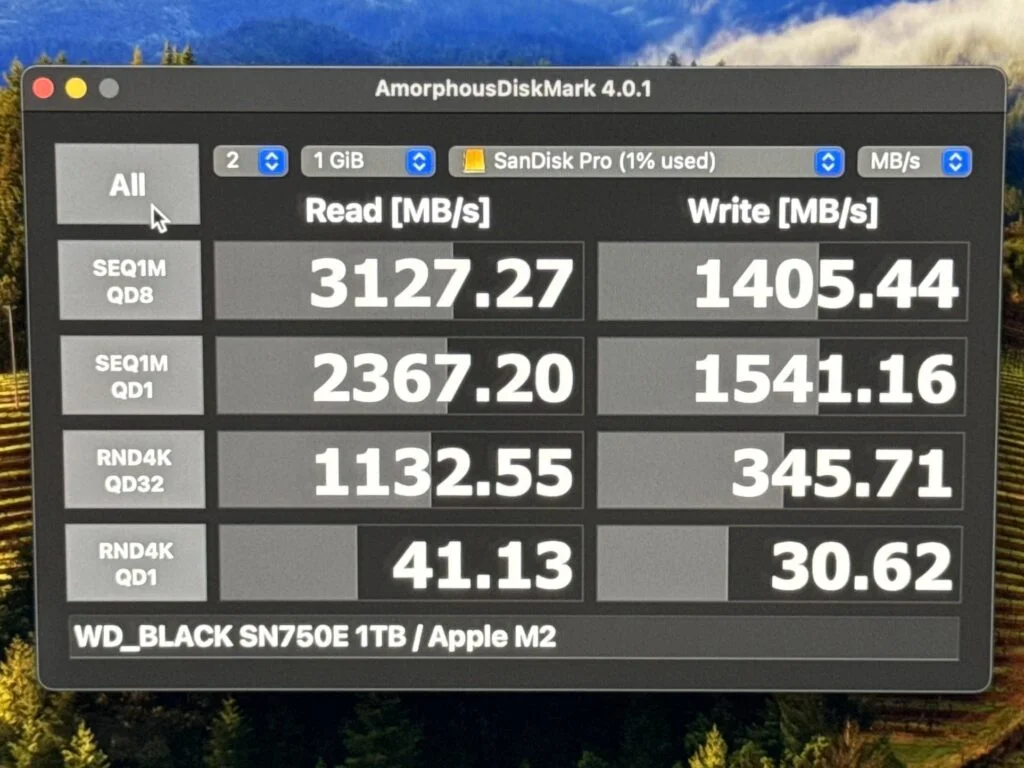
AmorphousDiskMark is the macOS counterpart to CrystalDiskMark, providing SEQ1M and RND4K read/write benchmarks in MB/s and IOPS. The result above shows fixed rows, SEQ1M at QD8 and QD1 and RND4K at QD32 and QD1.
AmorphousDiskMark
AmorphousDiskMark probes macOS bottlenecks on two storage paths
Because it runs on macOS, it can show macOS-specific limits such as a Thunderbolt enclosure or an Apple Silicon NVMe drive, and it lets you set those results beside CDM-style results from other systems.
Synthetic toolkit summary
Each tool in this part serves a distinct purpose. Overlap is intentional, because cross-referencing results between tools exposes inconsistencies that a single tool would miss.
Synthetic toolkit summary
Six tools cross-check one drive by comparing results
| Tool | Primary Strength | Data Pattern | Best For |
|---|---|---|---|
| CrystalDiskMark | Spec sheet verification | Incompressible (default) | Confirming rated speeds, comparing hero numbers |
| ATTO | Transfer size sweep | Not shown in the settings | Controller ramp-up analysis, identifying small-I/O weaknesses |
| AS SSD | Worst-case performance | Incompressible (standard run) | True NAND throughput, access time, copy simulation |
| Anvil | QD scaling & response time | Configurable | IOPS scaling curves, bridging consumer and enterprise testing |
| KDiskMark | Linux CDM parity | Incompressible | Cross-OS baselines |
| Amorphous DiskMark | macOS CDM parity | Random/Zero | Cross-OS baselines |
A note on synthetic discipline
Synthetics are only as good as the methodology behind them. Every test in this part must be run on a locked-down system with a pre-conditioned drive at the correct fill level, as Part 1 sets out. Run each tool a minimum of three times, each a separate launch of the tool, and report the median, not the peak. If your three runs vary by more than 5%, something in your environment is not controlled, and it needs fixing before you publish.
A note on synthetic discipline
Three runs within 5% mean the environment is controlled
Part 3 moves beyond controlled laboratory conditions into trace-based and real-world testing, where the variables multiply.
Sources
Primary is the original paper, standard or datasheet. Secondary is a review, a vendor summary or a news report. Measured is my own test data.
Show all 2 sources, 1 primary
- PrimaryCrystalDiskMarkCrystal Dew World [en]
- MeasuredThe author’s own measurements