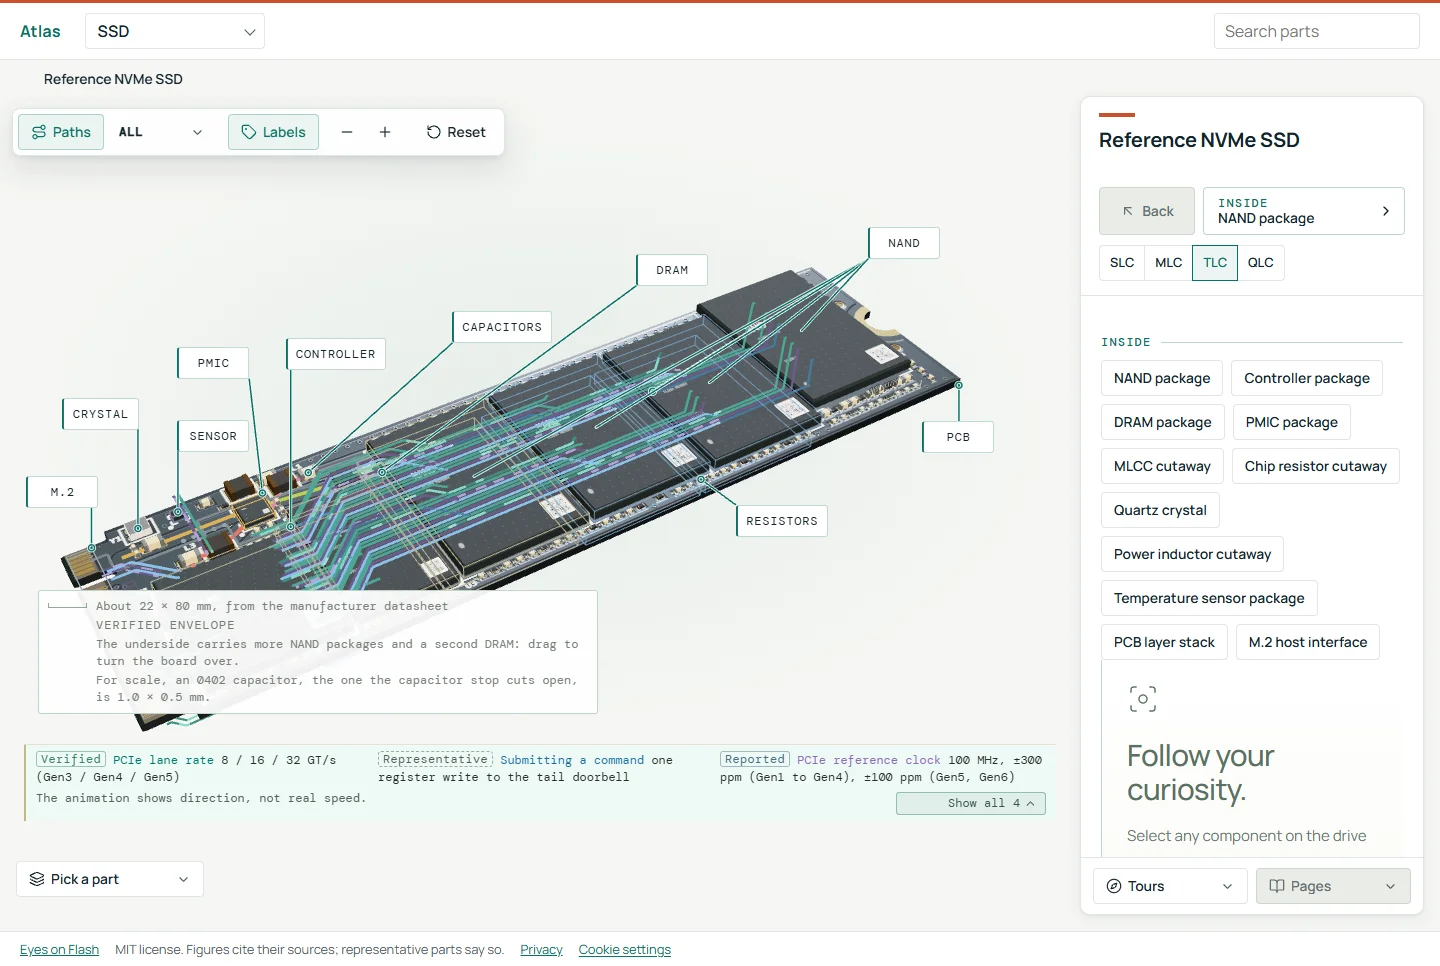
NAND flash cannot manage itself. It holds charge in charge-trap or floating-gate structures, but it cannot decide where to write incoming data, when to erase blocks, how to correct accumulating bit errors, or when to throttle for heat. Those decisions fall to the controller. That chip turns raw flash into a drive.
Flash Foundations
Flash Foundations, Part 5: The Controller
Meet the processor coordinating the host, NAND, and the firmware inside an SSD.
On this page 30 sections
Part 4 ended with the tall 3D stacks the controller has to manage. This part covers the chip that manages them: the system on a chipThe controller is a system on a chip with CPU cores, hardware engines, memory and interfaces to both the host and the NAND. (SoC) that sits between the host and the NAND array, and the power and clock parts around it that keep it running.
Channel count is fixed in silicon and caps NAND-side throughput, and no firmware update raises it. Firmware still decides how much of that ceiling a drive reaches. By the end of this part you can work out where a drive’s parallelism ceiling sits, explain what a wake from deep idle costs, follow the power and clock paths around the chip, and read a controller and its board faults from the host. Every firmware function in Part 6 through Part 9 runs on this chip.
Architecture of a controller
Every controller does the same four jobs. It talks to the host, reaches NAND in parallel, corrects errors, and translates logical addresses to physical locations. That architecture follows from the jobs. Each gets its own subsystem on one chip: host interface logic, NAND channel interfaces, an error correction codeError-correcting codes add parity bits to each block of data so the controller can find and fix bit errors on read. (ECC) engine for low-density parity-checkLDPC is a code whose decoder passes confidence messages back and forth until the errors resolve. It corrects more errors than BCH, especially with soft input. (LDPC) codes, and CPU cores. Those cores run the flash translation layerThe flash translation layer is the firmware that maps host addresses to physical flash locations and hides the rules of erase blocks and wear. (FTL), the logical-to-physicalThe logical-to-physical table records where each logical block currently lives in flash. Every write changes an entry, and every read looks one up. (L2P) map that lets a write-once medium behave like a rewritable one, along with garbage collectionGarbage collection copies the valid pages out of mostly stale blocks and erases those blocks, so there is always free space for new writes. (GC) and wear leveling. To find the controller on a real M.2 boardAn SSD board carries the controller, the NAND packages, optional DRAM, power regulation and the connector, laid out to keep the signal paths short., rotate the drive in the Atlas and click it.
Architecture of a controller
Four jobs map to five subsystems on one chip
Host in, NAND out, firmware and hardware engines between
Figure 5.1 pairs each job with its subsystem. Channel interfaces are outlined in copper because they are the one part firmware cannot change. The number of channels is set when the chip is designed. Below, the table gives the typical range for each subsystem and the constraint that matters.
| Subsystem | Function | Typical range | Key constraint |
|---|---|---|---|
| CPU cores | Execute firmware for the FTL, GC scheduling, wear leveling and command processing | Arm Cortex-R cores plus vendor accelerator cores: Phison’s E18 has three Cortex-R5 cores, and the E26 pairs two of them with three CoXProcessor units | Core count and clock set how fast the firmware responds to workload changes and schedules background work |
| Host interface logic | PCIe transaction handling, NVMe command processing, submission and completion queue management | Must sustain about 8GB/s for Gen4 x4 and about 16GB/s for Gen5 x4 | Becomes the throughput bottleneck if undersized for the PCIe generation |
| NAND interface channels | Independent data paths to NAND dies, so reads, writes and erases run in parallel | 4 to 8 channels (consumer), 8 to 16 (enterprise) | Channel count sets the NAND-side throughput ceiling, fixed in silicon and not recoverable by firmware |
| ECC engine | LDPC error correction in dedicated hardware at line rate | Strength depends on the code and the codeword size, and Part 8 works the numbers. Soft-decision variants add reliability data from extra reads at offset voltages for more margin | Must be hardwired. LDPC in firmware on the CPU cores would stall every read |
| DRAM controller | Manages the L2P map cache on drives with dedicated DRAM | LPDDR4 or DDR4 class, depending on the design | Absent in DRAMless designs, which push the lookup onto NAND itself |
Every I/O consults the map. The cost of a lookup depends on where the map lives. It can sit in dedicated on-drive DRAM, host memory through the Host Memory BufferHost memory buffer lets a DRAMless NVMe drive borrow a small region of host RAM to cache part of its map. (HMB), or NAND behind a small static RAM (SRAM) cache. Part 6 compares them and works the sizing arithmetic. Some controllers also present several PCIe functions, so one drive can serve several virtual machines through Single Root I/O VirtualizationSR-IOV lets one physical PCIe device present itself as several virtual functions, so each virtual machine can talk to its own slice of the drive. (SR-IOV).
Channels and parallelism set the performance ceiling
Channel count sets the ceiling on NAND-side throughput. Within that ceiling, the number of populated dies and channels sets sustained speed, even with the same controller, NAND and firmware. A larger drive on the same controller populates more dies, and often more channels, so it sustains higher throughput under load, as Part 3 showed.
Each channel is an independent data path from the controller to one or more dies. On an 8-channel design, a read on channel 0 can run at the same time as reads on channels 1 through 7. Multiply the active channels by the per-channel data rate and you get the NAND bus ceiling, though the host link or die program time often caps throughput first.
Within a channel, the controller selects dies with chip enable (CE)A channel is a bus from the controller to a group of dies. Chip enable lines select which die on the channel is addressed. signals. A CE line selects one target, and a target holds one or more dies. A die that can run commands on its own is a logical unitA LUN, or logical unit, is the smallest part of a NAND package that can run its own command independently. On most parts it is one die. (LUN), the addressing term in the Open NAND Flash Interface (ONFI) standard, and on most parts a LUN is one die. This series says “die” except where the addressing is the point. To reach a specific die on channel 2, the controller asserts that target’s CE on channel 2 and leaves the other CE lines inactive.
Channels and parallelism set the performance ceiling
A channel carries several dies, and each die holds planes
8 channels × 4 dies × 2 planes, scaled down
Figure 5.2 shows the nesting, from the channel to a target chosen by CE, then the die (LUN), then its planes. Controller briefs show the scale. The Silicon Motion SM2258XT has four channels with four chip enables each, and Marvell’s 88SS1092 has eight channels with up to eight each, so one controller can select 64 targets independently. Channel counts follow the same split. The SM2258XT and Phison’s E31T have four channels, Samsung’s Pascal and Presto have eight, and Silicon Motion’s enterprise SM8366 has 16. CE lines and dies are different counts, because one CE line selects a target that can hold several dies. CE count times the LUNs behind each CE sets how many dies can have operations in flight at once, which is the parallelism depth below the channel level. Dies on one channel still time-multiplex its data bus. It can pipeline commands (a read to die 0, then a read to die 1 before die 0 completes), but it cannot move data from both at the same instant. Typical counts at each level are in the table.
| Level | Typical count | What parallelism adds |
|---|---|---|
| Channels | 4 to 8 (consumer), 8 to 16 (enterprise) | Independent concurrent operations |
| Chip enables per channel | 4 to 8 | Interleaved operations within a channel |
| Planes per die | 2 to 6 | Multi-plane operations within a die |
A stuck or non-responsive CE line removes every die on that chip select from the addressable pool. That follows from how CE selects a target, so in fleet telemetry a failure would show as a sudden loss of spare capacity (on drives built for capacity reduction, a stepwise drop in usable capacity) paired with a decline in sustained write throughput. This is reasoning from the architecture and not a published failure signature, and it is a reason to check for a CE failure before you blame media wear or the controller.
Why die collisions make queue depth help less than one-for-one
Parallelism only pays when there are commands to spread across it. Queue depth sets that, and it is the number of commands the host keeps in flight. Part 1 covers the NVMe queue model that allows it. At queue depth 1, a single read takes about 25 to 170µs (40 to 170µs for the TLC and QLC dies in the Eyes on Flash die dataset, 25µs for a classic SLC part) and one die works. With a queue depth of 32 or higher, dozens of commands can run across channels and dies at once. A command scheduler decides how they spread, and one that leaves channels idle while others are saturated wastes the headroom the hardware provides.
A deeper queue helps, but not one-for-one, because commands land on dies at random and some land on the same die. With N dies and Q commands outstanding, about N × (1 − (1 − 1/N)^Q) dies are busy. With 64 dies (the 64 targets Marvell’s 88SS1092 can select, if each holds one die) and 64 commands in flight, that is about 41 busy dies, so around 23 commands are waiting behind another one.
Why die collisions make queue depth help less than one-for-one
A deeper queue keeps more dies busy, but never all of them
64 dies, commands landing on random dies
Figure 5.3 plots that formula for 64 dies. Curve and ideal line sit together while the queue is small, then separate as the queue becomes a sizable share of the die count, and the curve nears 64 only when the queue is several times deeper than the die count. Queue depth and latency also set a ceiling on their own. In-flight commands divided by the time each one takes gives the most reads per second the die side can finish (Little’s law). Thirty-two reads in flight at 80µs each, the read time SK hynix printed for its 321-layer QLC die at ISSCC 2025, complete at most 400,000 reads per second, and collisions pull the real number below that. That waiting is why the slowest few commands get slower as the queue deepens even while the average improves. It is also why controllers keep a short queue for each die and stop taking new commands from the host when one of them gets too long.
How fast the controller talks to flash
Controllers talk to NAND dies through standardized electrical interfaces. That interface sets raw channel bandwidth, timing precision, cross-vendor compatibility, and which NAND vendors a controller can pair with. Two dominant standards, ONFI and ToggleONFI and Toggle are the two families of NAND interface standards. Both move data with a double-data-rate strobe and differ in signaling details., developed in parallel and remain associated with different NAND suppliers. JEDEC’s JESD230 is the interoperability standard for devices that follow either one. Part 1 introduces both buses and the strobe signaling they share, so this section keeps to speeds and what they cost.
ONFI
The first ONFI specification dates from December 2006, and the standard moved through synchronous double-data-rate modes with each generation. Commands, addresses and data travel over a parallel bus, and the NAND responds within defined timing windows. As of October 2026, ONFI 6.0 (revision dated December 2025) is the newest generation in the table, and its cover names Micron, Phison, Western Digital, SK hynix and Sony as authors. It drops the definitions of the legacy SDR, NV-DDR2 and NV-DDR3 interfaces and extends NV-LPDDR4 up to 4,800MT/s.
| ONFI generation | Mode | Peak transfer rate (MT/s) |
|---|---|---|
| 1.0 | Asynchronous SDR | 50 |
| 2.x | NV-DDR (synchronous) | 133–200 |
| 3.x | NV-DDR2 | 400–533 |
| 4.0 | NV-DDR3 | 800 |
| 4.1 / 4.2 | NV-DDR3 | 1,200–1,600 |
| 5.0 / 5.1 / 5.2 | NV-DDR3 / NV-LPDDR4 | 2,400–3,600 |
| 6.0 | NV-LPDDR4 | 4,800 |
Toggle DDR
Toggle Mode is an asynchronous double-data-rate interface that needs no clock signal. Toshiba introduced Toggle DDR 1.0 in August 2010, timing transfers with a bidirectional data strobe (DQS) in place of a shared clock. A few weeks earlier, Samsung and Toshiba had committed to a 400Mbps Toggle DDR 2.0. Samsung’s V-NAND and the BiCS NAND from Kioxia (formerly Toshiba) and Sandisk use Toggle. Both families have converged in raw speed at their current generations, and controllers that support both can pair with NAND from either family.
| Toggle generation | Mode | Peak transfer rate (MT/s) |
|---|---|---|
| 1.0 | Toggle DDR 1.0 | 133 |
| 2.0 | Toggle DDR 2.0 | 400 |
| 3.0 | Toggle DDR 3.0 | 800 |
| 4.0 | Toggle DDR 4.0 | 1,200–1,400 |
| 5.x | Toggle DDR 5.x | 2,400 to 3,200 |
| 6.0 | Toggle DDR 6.0 | 4,800 |
Samsung’s 2022 release puts Toggle DDR 4.0 at 1,200MT/s, and its first 4.0 part ran at 1,400MT/s, so the table shows both. Figure 5.4 plots the upper end of every range in the two tables on one logarithmic axis.
How fast the controller talks to flash
Both interface families climbed more than an order of magnitude
Peak transfer rate by generation, in table order, not date-aligned
Both families climb by more than an order of magnitude and end at 4,800MT/s in their newest listed generation. ONFI has one more step than Toggle in the tables, so the two lines end at different positions on the axis. Each step is large enough that I expect each controller generation to need validation against a new interface.
Per-channel bandwidth is the transfer rate times the bus width, divided by eight. A NAND I/O bus is 8 bits wide, so 1,600MT/s yields 1,600MB/s (1.6GB/s) per channel. An 8-channel controller with all channels active at 1,600MT/s reaches 12.8GB/s aggregate NAND bandwidth. A PCIe 4.0 x4 link caps host-side throughput at roughly 8GB/s, and a drive’s real sequential ceiling is whichever of the two is lower. With Gen5, the host link doubles to around 16GB/s, which is more than eight channels at 1,600MT/s can feed (12.8GB/s), so NAND interfaces had to climb to 2,400MT/s and beyond: eight channels at 2,400MT/s is 19.2GB/s.
Random input/output operations per second (IOPS) don’t scale the way sequential throughput does. With a queue depth of 1, a single read takes about 25 to 170µs whether the bus runs at 800 or 1,600MT/s, because the limit is NAND read latency and interface bandwidth plays little part. Interface speed matters for sequential transfers and drive fills. Latency is the limit for random I/O.
Why the bus had to keep getting faster
A page read has two stages. First, the array senses the page into the die’s page register, which takes the read time (tR). Then the page crosses the channel at the bus rate. For a page of P bytes on an 8-bit bus running at R megatransfers per second, the second stage takes P/R µs. Micron’s technical note on a classic 2Gb SLC part shows the original balance: a 25µs array read, then 25ns per byte for a 2,112-byte page, about 53µs on the bus, double the array time.
Pages have grown since then, and the array read has grown far less. In the Eyes on Flash dataset, the 16KB TLC and QLC dies read a page in 40 to 170µs. A page that size crossing a slow bus would take far longer than the array took to fetch it.
Why the bus had to keep getting faster
On a slow bus, moving a 16KB page takes longer than reading it
Time to move one 16KB page over an 8-bit channel
Figure 5.5 divides one 16KB page by each interface rate. At 400MT/s the transfer takes about 41µs, level with the fastest read time in the band. At 4,800MT/s it takes about 3.4µs. The dashed line marks the 80µs read time SK hynix printed for its 321-layer QLC die at ISSCC 2025. Where the curve sits above the band, the bus is the slower stage, and where it falls below, the array is.
InterleavingInterleaving overlaps work on different dies and channels so one die programs while another transfers data, keeping the bus busy. adds a second demand. While one die senses a page, the controller can move another die’s page, so a channel with N dies has to deliver N pages every tR to keep them all busy. With 8 dies of that SK hynix part (16KB page, 80µs read), that is 8 × 16,384 bytes every 80µs, about 1.6GB/s, which an 8-bit bus reaches at roughly 1,600MT/s, half the 3,200MT/s the interface allows for. This is arithmetic with the page size and die count held fixed, and it assumes nothing else limits the channel. It shows how much bus speed a fast die can use, and the Parallelism Lab lets you change the page size, die count and rate to see where the limit moves.
On units, the paper’s table prints the 3,200 figure as MB/s and its text says 3.2Gb/s, but both describe a single pin. One pin carries 3.2Gb/s, so an 8-bit bus at 3,200MT/s moves 3.2GB/s.
Why a channel cannot hold unlimited dies
Every die on a channel adds capacitance to each shared data line, and the controller’s driver has to charge that capacitance on every transition. ONFI 4.2 gives the typical input capacitance of an I/O pin by the number of LUNs sharing one x8 data bus inside a package, defined for NV-DDR and NV-DDR2 BGA parts. Typical values run from 4.0 to 5.7pF for one LUN up to 20.7 to 28.7pF for eight, and the table stops there.
Why a channel cannot hold unlimited dies
Eight dies on a bus carry about five times the load of one
Typical I/O pin capacitance, upper end of the ONFI range
Figure 5.6 plots the upper end of each range. Eight LUNs carry about five times the load of one, so the load grows more slowly than the die count but still adds up. A heavier load slows the edges on the bus, and it also costs energy. Switching power on the data lines follows P = 9 × η × f × C × V², where the 9 is eight data lines plus the strobe, f is the transfer rate, C the load per line, V the I/O supply voltage and η an average activity factor across the nine lines. Estimates below use 0.5 for η, which is a model value rather than a measurement, and 28.7pF for C, which is the eight-LUN figure.
| I/O supply (VccQ) | Power per MT/s | One channel at 1,600MT/s |
|---|---|---|
| 3.3V | 1.41mW | 2.25W |
| 1.8V | 0.42mW | 0.67W |
| 1.2V | 0.19mW | 0.30W |
Rows for 3.3V and 1.8V are hypothetical at 1,600MT/s. They show the V-squared scaling.
The I/O supplies in the table are 3.3V, 1.8V and 1.2V, and Part 3 gives the VccQ levels of NV-DDR3 and NV-LPDDR4. Voltage enters squared, so moving from 3.3V to 1.2V cuts the switching power per transfer by about 7.6 times at the same load. That is the reason I/O voltage kept falling as rates climbed. It also puts a price on every die added to a channel.
Hardware engines versus firmware
Controllers split functions between dedicated hardware enginesHardware engines are fixed circuits for the heavy, repetitive jobs such as error correction, encryption and data movement. They run faster than firmware could. and CPU-executed firmware, which trades throughput against adaptability. Hardware engines handle the computation-heavy, timing-critical work that must complete at line rate without burdening the CPU cores: LDPC encoding and decoding, AES encryption, cyclic redundancy check (CRC) calculation and NAND interface timing control. Firmware handles the operations that benefit from adaptability, such as the FTL, GC scheduling, wear leveling decisions, thermal throttling policy and TRIMTRIM, called Deallocate in NVMe, tells the drive which logical blocks the file system no longer uses, so garbage collection need not copy them. processing. Those algorithms are complex and can be revised over the product lifetime.
Engines also have to keep pace with the host link, and a controller meets that by running several in parallel. Take a hard-decision LDPC decoder that sustains 1.2GB/s, a teaching value rather than a measured one. A Gen4 x4 link at about 8GB/s then needs seven decoders working at once, and a Gen5 link needs twice that. Soft decoding, covered in Part 8, costs more time per codeword, which is one reason decoders are replicated.
Hardware engines versus firmware
Timing-critical work is wired, policy is firmware
Where each controller function runs
Figure 5.7 draws the line. Because policy lives in firmware, an OEM that needs to tune GC aggressiveness for a workload can do it with a firmware update and no change in silicon. Two OEMs can ship the same controller silicon with different firmware tuning, and firmware sets how the drive behaves under sustained load. A Phison E26 firmware update changed the thermal throttle curve, for example. Its cost is that the engines cannot change after the chip is built, so the silicon sets what the firmware can ask of them.
AES, self-encrypting drives, and crypto erase
AES hardware enables self-encrypting drives (SEDs)A self-encrypting drive encrypts all data with AES in hardware as it is written, using a media key that the drive itself holds.. An SED always stores user data encrypted, using a media encryption key (MEK) that only ever exists in plaintext inside the controller. Under the Trusted Computing Group (TCG) Opal specification, the host sets an authentication credential that wraps the MEK in storage, so the drive needs that credential before the data becomes accessible after a power cycle.
A practical payoff for data center operations is crypto eraseCryptographic erase destroys the media encryption key, which makes all data encrypted under it unreadable without erasing the flash itself.. Destroying the MEK makes all encrypted data on the NAND cryptographically unrecoverable almost instantly. It is the mechanism behind NVMe Sanitize Crypto Erase, and the right approach for decommissioning and between-tenant reuse whenever the drive is an SED. Part 6 compares all three sanitize variants, including the block-erase variant that spends a program/erase (P/E) cycle on every block. AES runs at line rate, so normal I/O doesn’t slow down.
Read reference calibration
One of the most consequential ongoing firmware jobs is calibrating the read reference voltagesRead-reference calibration hardware measures how the threshold distributions have moved and adjusts the read voltages to follow them.. Part 2 and Part 3 established that cells store data as threshold voltage states, and that those states drift with P/E cycling, temperature and retention time, and compensation has to happen in real time.
Temperature is one of the drifts the references have to follow. A patent filed by Toshiba in 1996 on temperature-compensated read voltages (US 5,864,504) describes a cell threshold that falls as temperature rises, and puts the swing at up to 0.30V across −35 to +85°C. Its read voltage generator moves with the cell, by 0.28V over that range, which leaves about 0.02V of extra margin to budget instead of 0.30V. In that design the read reference either follows temperature or the margin has to absorb the whole swing.
Firmware can keep per-die, per-block and, on some controllers, per-layer tables of read references, the analog thresholds that map a cell’s stored charge to a bit. Tables aren’t set at the factory and left alone. Controllers update them as it observes error rates, temperature and wear for each region of the array. When a block’s error rate crosses a calibration threshold, the firmware schedules a background pass that reads the block at a series of offset references and keeps the setting with the lowest raw bit error rateRaw bit error rate is the fraction of bits read from the NAND that are wrong before error correction is applied. (RBER). That work uses NAND bus time and creates background read traffic the host never sees. Part 8 covers read retry, which uses the same shifted references on a failed read.
Calibration depth is one of the clearest differences between controller generations and firmware tiers. A controller with coarse calibration shares one set of references across many blocks and layers, so some regions always read off-center. One with per-layer tables adjusts continuously, which keeps RBER lower and extends effective endurance. On a fresh drive the difference is invisible. It shows up in error rates and read retry frequency as the drive accumulates terabytes writtenTerabytes written is the total host data a manufacturer rates a drive to absorb over its life under the warranty conditions. (TBW).
The program order the firmware cannot break
Firmware doesn’t write pages within a block in arbitrary order. In a 3D NAND block, wordlines are programmed in a fixed sequence, typically from one end of the string to the other. Capacitive coupling is the reason. The charge added to one wordline shifts the threshold voltage of cells on the wordlines next to it, as Part 3 describes. A wordline already at its final state has no correction pass left, so that shift would widen its distributions.
Multi-passMulti-pass programming writes a page in two or more passes, first a coarse placement of charge, then a fine pass that tightens each level. schemes work around this. They leave the lower wordline at a coarse state, run the next wordline’s first pass, then finish the lower wordline with a fine pass that cancels most of the shift. Each wordline’s first pass can start before the one below it completes its final pass, so passes interleave across neighboring wordlines, always in the vendor’s fixed order.
The program order the firmware cannot break
A wordline gets its fine pass after its neighbor’s coarse pass
Three wordlines, one program step at a time
Figure 5.8 shows one such order. Each fine pass follows the coarse pass of the wordline above it, so the shift left to correct is small and predictable. Exact order depends on the vendor’s program algorithm, so treat the figure as the idea rather than any one part’s sequence.
Page order within a wordline is just as strict for multi-bit cells. Some parts program a wordline’s pages in one pass, and others program the lower page first, then the middle, then the upper. Upper-page programming uses the finest voltage resolution and depends on the exact distribution the earlier passes set, so the vendor fixes the page order. Out-of-order programming leaves threshold mismatches, and the errors look like a calibration offset rather than random wear. Across blocks in a superblock, the controller pipelines operations, so while wordline N on block 0 is programming, wordline N on block 1 can be receiving its command.
In failure analysis, look at where the bit errors sit, reasoning from each mechanism. Oxide wear spreads them evenly or concentrates them on one page type, and Luo’s 2018 Carnegie Mellon thesis reports that the overall raw bit error rate increases exponentially as flash wears out with P/E cycling. Read disturb builds up on the unread wordlines of a heavily read block, so it should track read counts per block rather than stack depth. Errors that cluster at specific wordline depths beyond the part’s normal layer-to-layer profile call for a check of whether the firmware followed the sequence, because out-of-order programming leaves its own spatial pattern. Reading that spatial signature first separates the failure classes before you spend time on a wear diagnosis.
NVMe power states and idle latency
NVMe allows up to 32 power states per controller. One client drive exposes far fewer. The Western Digital PC SN730 manual lists five, PS0 through PS4, with PS0 at full performance and PS4 the deepest idle state at 3.5mW. PCIe’s physical layer has a complementary ladder of L0 (active), L1 (standby) and the L1 substates L1.1 and L1.2, where L1.2 lets all the high-speed circuits turn off.
NVMe power states and idle latency
Deeper idle saves more power and costs a longer wake
NVMe power states beside the PCIe link states
Figure 5.9 draws both ladders. Each step down saves more idle power and takes longer to leave. Storage devices spend significant time idle in most real workloads, which is why the states exist, and the trade-off is exit latency. Waking from PS4 or L1.2 requires the controller to reinitialize subsystems, the PCIe link to retrain and clocks to stabilize before the first command can run. Wake length is vendor specific. For the SN730, the manual lists a 4.5ms entry and a 35ms exit latency for PS4, against 4ms and 10ms for PS3, and the cost lands on the first I/O after an idle period. Most benchmarks never see it because they keep I/O running continuously. Laptops, edge devices and interactive workloads that pause between bursts hit it often, as an intermittent first-I/O latency spike with no matching error log entry.
Autonomous Power State Transitions (APST) lets the drive move between power statesNVMe power states are numbered levels that trade performance for power. Each lists a maximum power and the time needed to enter and leave it. on its own, instead of waiting for host commands. Host software builds a table of idle timeouts and target states from its own latency tolerance, and the drive steps into the listed state once each idle timer expires. Linux enables APST by default, and the SN730 manual says that during its average active-power test the Microsoft StorNVMe driver triggers a non-operational low-power state, so that drive does use its idle states under Windows.
For latency-sensitive deployments, an administrator can disable APST and the PCIe link power-saving feature, Active State Power Management (ASPM), so the drive stays in PS0 with the link in L0. That removes wake latency at the cost of higher idle power. Red Hat’s power management guide notes that ASPM raises device latency because of the link state transitions and offers a policy that turns it off. NVMe’s Set Features command controls the active power state (Feature ID 02h, Power Management), and APST configuration is Feature ID 0Ch.
Power and clock around the controller
A controller is one package on a crowded card, and the rest of an M.2 board exists to power it, clock it, connect it, or hold its data. When a drive refuses to enumerate or dies after a power event, the cause sits on the board as often as in the silicon. Each part appears on a reference board in the Atlas that you can rotate and take apart. This section covers the power and clock parts the controller depends on. It starts with the power management IC (PMIC)A power management IC converts the host supply into the several voltages the controller, DRAM and NAND need, and sequences them at power-up., its inductors, the capacitors, the resistors and the clock sources. Connector and board, NAND packages, DRAM rails and temperature sensors belong to other parts, linked below.
Power and clock around the controller
One 3.3V input becomes every rail, and two clocks feed the SoC
Block diagram of the parts around the controller
Figure 5.10 follows the supply and the clocks separately. A copper outline marks the PMIC, drawn as the path from the 3.3V input to the controller, NAND and DRAM rails. The PMIC sets the order those rails come up in, while the clocks bypass it.
The edge connector: power, clock, and sidebands
Power arrives on the M.2 connector at 3.3V (the Western Digital PC SN730 manual lists 3.3V ±5%), and the host also supplies the 100MHz PCIe reference clock and the PERST# reset line. Part 1 covers the pins, the power budget and the U.2 and EDSFF supply limits. Board impedance and AC coupling are in Part 1, NAND packages and VccQ in Part 3, the DRAM rails in Part 6, and the temperature sensors in Part 9.
The PMIC and its inductors
Controller core, NAND core, NAND interface and DRAM each need a different voltage, held tighter than the host supply. A PMIC bridges that gap with several switching regulators (buck converters) and one or more linear regulators (LDOs) in one package. Texas Instruments’ LM10504, built for SSDs, has three bucks and an LDO, with the controller core on a buck adjustable from 0.7 to 1.335V. It switches at 2MHz to keep the inductors small.
Every buck needs an inductor outside the PMIC, which stores energy during each on-phase and releases it during the off-phase. Counting the inductors beside the PMIC gives a rough count of its switching rails. A PMIC also sets the order, because rails come up in a set sequence and the controller stays in reset until they are stable. A failed PMIC or a shorted rail usually leaves the drive invisible, because the controller never leaves reset.
Capacitors: decoupling, coupling, and hold-up
Capacitors do three jobs, and decoupling is the one this part owns. Small multilayer ceramic capacitors (MLCCs) sit next to every package and supply the burst current silicon pulls faster than a regulator across the board can respond. TI’s layout guidance puts a 1nF to 0.1µF high-frequency capacitor right next to a regulator’s input pins. MLCCs are brittle, and a cracked one can short the rail it protected. AC coupling of the PCIe lanes is in Part 1, and the hold-up bank on drives with power loss protectionPower loss protection uses stored energy to let a drive finish writing buffered data and metadata when power fails, so acknowledged writes survive. (PLP) is in Part 6.
Resistors
Resistors set things. A divider sets each regulator’s output, because the feedback pin connects to the tap of a resistor divider and adjusts until the tap reaches its reference. Fast memory interfaces calibrate their output drivers against a precision resistor on a ZQ pin. For NAND that uses ZQ calibration, the JEDEC and ONFI package standard says the RZQ ball connects to Vss through a 300Ω, ±1% resistor. Whether a drive uses a discrete part or builds the function into the controller depends on the design.
The crystal: local timing
Controller phase-locked loops (PLLs) need a stable local reference to build the internal clocks, and a small quartz crystal supplies it. Murata’s reference table of crystals for SSD controllers lists 25MHz for the Phison E12 and the Silicon Motion SM2262 and SM2263. That crystal doesn’t drive the PCIe link. In the common-clock arrangement, link timing comes from the host’s 100MHz reference clock, so both ends share a reference. Separate Reference Clock with Independent SSC (SRIS) lets each side run its own spread-spectrum clock instead, a way to build an inexpensive PCIe cabling solution for SSDs.
In the field: identify the controller and its board
A field engineer supporting a deployment has one question to answer first. What is inside this drive, and what does that say about how it should behave and what to check when something goes wrong? Knowing the controller vendor changes where an investigation starts. Three questions sort most board-level cases from firmware ones before any deeper analysis.
In the field: identify the controller and its board
Three questions separate board, firmware and link problems
First checks before a drive goes back as dead silicon
Figure 5.11 orders the first checks. A drive that does not enumerate points at the board path. One that enumerates with a generic name and a wrong capacity is running from boot ROM because its firmware never loaded. One that trains a narrower or slower link than both ends support points at the physical path. It orders the checks and doesn’t replace a vendor diagnostic.
Identify the controller from the host
On Linux, nvme id-ctrl /dev/nvme0 returns the full Identify Controller data structure in human-readable form. PCI Vendor ID (VID) and Subsystem Vendor ID (SSVID) fields show who registered the device with PCI-SIG, which is usually the controller vendor and sometimes the drive maker. Combined with the drive model, the firmware revision string usually identifies the controller family when you cross-reference it with the OEM’s release notes.
Windows has no direct equivalent of nvme id-ctrl without third-party tooling. CrystalDiskInfo surfaces the model, firmware revision and interface type, which is enough to identify the drive but not to see the full Identify Controller structure. Vendor applications such as Samsung Magician, Sandisk Dashboard and Kingston SSD Manager give health monitoring and firmware updates for their own products only. In PowerShell, Get-PhysicalDisk | Get-StorageReliabilityCounter reports reliability counters such as temperature, errors, wear and time in use through the Windows storage stack, which works as a quick health check before you pull deeper data.
Read the firmware and the host configuration first
A drive running firmware two or more revisions behind current is a candidate for a firmware update before any deeper investigation, as a matter of practice and not a measured rule. Symptoms such as inconsistent TRIM handling, GC-induced tail latency and unexpected thermal throttling at moderate queue depth can come from firmware behavior, so check the firmware revision and its release notes before suspecting hardware.
Two host-side causes often pass for drive faults. Tail latency spikes at high fill levels are frequently GC pressure rather than hardware. As fill rises, effective overprovisioning shrinks and GC competes with host writes for free blocks, and the pattern clears when the fill level drops, as Part 9 covers. Elevated write amplification factorWrite amplification factor is the data written to NAND divided by the data the host wrote. A value of 1 means no extra internal writes. (WAF) in an array often traces to a host that never passes TRIM through, so GC keeps relocating data the host already deleted, as Part 7 covers. In both cases the fix is host configuration, and the drive can stay.
Once controller identificationThe controller and firmware can be read from the drive identify data, the vendor tools or the markings on the chip. names the family, pull the full NVMe error log alongside SMART data to build the evidence chain. A related failure is a queue arbitration deadlock in the firmware of an array’s storage controller card, triggered when the drives behind it act in sync. My account of what that looks like when every downstream device demands attention at once is The All-at-Once Failure.
Both the Identify Controller response and the SMART / Health Information log also hold fields that separate configuration problems from hardware faults:
- A drive that loses data after a power event but logs no media errors may have a volatile write cache the host stack never explicitly flushed.
- A DRAMless drive with erratic random read latency may not have received the host memory buffer allocation the firmware expected, and without checking, it looks exactly like a defective drive.
- Commands failing unexpectedly may reflect capabilities the controller never advertised but the host assumed were present.
Telemetry and power
Most monitoring tools surface the SMART Critical Warning field as a single binary alert, but it is a bitmap. Spare threshold exhaustion, temperature out of range, reliability degradation, read-only mode and the PLP capacitor fault are each a separate condition, with its own root cause and response. Part 8 covers the SMART fields in full. The hold-up numbers behind the PLP fault are in Part 6’s power-loss section.
NVMe telemetry log pages (log IDs 07h and 08h, host-initiated and controller-initiated) go further than SMART. They expose vendor-defined internal data, including per-channel RBER, per-block erase count distributions, GC algorithm state, thermal throttle event history and internal queue metrics. Not all controllers implement telemetry at the same depth. Data center drives that follow the Open Compute Project (OCP) Datacenter NVMe SSD specification generally expose richer, more structured telemetry than consumer drives, which may implement minimal stubs that satisfy the log page request without meaningful content. NVMe defines how to read the log page but not the payload format, so decoding needs vendor documentation or tools. For field work, check whether the telemetry log returns a non-trivial payload. If it does, there is more diagnostic data to get, and it is worth engaging vendor support to decode it.
Power draw shows what error logs and SMART data can’t. Current peaks and voltage droop on the supply rail under peak I/O show how hard the drive pushes its power budget, which can help explain a throttling or latency event. Race-to-sleep measures how quickly a controller drops to a lower power state after a burst, and a long tail of activity before sleep often reflects background work such as GC and calibration. Quarch Power Analysis Modules capture these signatures at 4µs resolution. How I use power measurement alongside performance in reviews is in The Quarch Chronicles.
Reading the board in the field
A host sees the board only through the controller, so board faults show up as symptoms that look like something else. Check these patterns before you send a drive back as dead silicon.
| Symptom | Board-level suspect | First check |
|---|---|---|
| No PCIe device at all, nothing in BIOS | PMIC, a shorted rail (often a cracked MLCC), or seating | Reseat in a known-good slot. Measure current draw on the 3.3V input |
| Link trains narrower or slower than supported | Connector contacts, slot or riser, signal integrity | lspci -vv: LnkCap versus LnkSta |
| Enumerates with a generic name and wrong capacity | Firmware could not load from NAND, running from boot ROM | Vendor tools or a return merchandise authorization (RMA). The controller is alive |
| Resets or drops off the bus under sustained load | Rail droop at peak current, or heat | Temperature sensors 1 to 8 (Part 9), then a power trace of the 3.3V input |
| PLP fault in the SMART Critical Warning bitmap | Hold-up capacitor bank, covered in Part 6 | Treat write-cache safety as gone. Replace the drive |
A power trace answers questions logs cannot. If current spikes and the input voltage sags at the moment a drive resets, the problem is power delivery, and it may be the host’s or the drive’s. If the trace is clean and the drive still drops out, look at the link and the firmware instead. Part 1 covers the link check.
Boot ROM, not boot flash
In SK hynix’s description of its enterprise boot flow, ROM code reads the bootloader from the NAND, and the bootloader loads the full firmware image onto every CPU core. The same source says a fresh drive typically gets its first firmware image over a universal asynchronous receiver-transmitter (UART) serial port, the host interface, or the Joint Test Action Group (JTAG) debug port. That is why a drive with damaged firmware blocks can still enumerate from ROM, often with a generic name and a wrong or zero capacity: the controller is alive and the firmware never loaded.
Debug access
Manufacturing pins and test pads stay on shipped boards. Researchers who broke the hardware encryption on several self-encrypting SSDs reported that the Crucial MX100 has a JTAG interface that can be used to connect a debugger. A hobbyist’s 2020 reverse-engineering write-up of a Samsung M.2 SSD found nine vias along the board edge that formed a JTAG header, which the author identified by pin grouping and voltage levels. Data recovery shop Rossmann Group documents ROM-mode test pads on the Phison E12 and E16: shorting two test pads at power-on puts the controller into ROM mode, where recovery tools can load code into its RAM. Debug access left enabled is a security question as much as an engineering one.
Heat spreaders and labels
A label is often part of the thermal design. Samsung’s 990 Pro uses nickel coating on the controller and a heat spreader label, and the Enmotus FuzeDrive P200 uses a copper heat spreader label to aid heat dissipation. Peeling a label off to read part numbers changes how the drive sheds heat.
Enterprise management
Data center drives expose management over SMBus through NVMe-MI. Its specification allows the field-replaceable unit (FRU) and vital product data to live in an external device such as a serial EEPROM, so a baseboard management controller can read what the drive is without going through the NVMe driver.
Landscape: who builds controllers
Third-party drive makers typically select a controller from a merchant silicon maker such as Phison, Silicon Motion, Marvell or InnoGrit, as Tom’s Hardware reported in 2020. Each new PCIe generation needs new silicon, firmware and validation, and that cost is easier to spread across many customers, which favors merchant suppliers. Samsung builds its own controllers, and Kioxia also buys Phison controllers for some client drives. That matters for procurement decisions and for reading supply chain risk.
Landscape: who builds controllers
Merchant controllers share a platform, captive ones do not
As of October 2026, grouped by who may buy the controller
Figure 5.12 groups the vendors by who can buy the controller, and the table below lists the main ones. A merchant platform shortens time to market, because the silicon is already qualified and its firmware base has run across many deployed units. Less architectural control and shared exposure to the vendor’s firmware issues are the price. A captive design can tune firmware to its own NAND without compromise, but the investment is large, a ground-up design is a long project, and it pays off only at high volume with a captive NAND supply.
| Vendor | Models | NAND pairing | Position and note |
|---|---|---|---|
| Phison | E12 (Gen3), E18 (Gen4), E26 and E28 (Gen5) | ONFI and Toggle | Merchant supplier to many brands. The E26 offloads work such as ECC to dedicated CoXProcessor units |
| Silicon Motion (SMI) | SM2267 (Gen4, four channels), SM8388 (Gen5, eight channels), SM8366 (16 channels) | ONFI and Toggle | Merchant supplier with client and enterprise parts |
| Samsung | Elpis (980 Pro), Pascal (990 Pro), Presto (9100 Pro, Gen5) | Samsung V-NAND | Captive, used in Samsung’s own drives |
| Marvell | Bravera SC5 family (eight and 16 channels) | Broad | Aimed at cloud deployments, with a hardware Elastic SLA Enforcer for per-tenant quality of service |
| Sandisk and Kioxia | Proprietary, though Kioxia also uses Phison on some client drives | BiCS NAND, developed jointly | Own controllers for their own drives, plus Phison |
| InnoGrit | IG5236, IG5220 (DRAM-less, four channels), IG5666 | ONFI and Toggle | Client and enterprise lines |
| Maxio | MAP1202, MAP1602 | TLC and QLC | DRAMless Gen3 x4 controllers for cost-effective client PCs |
Supply concentration is a systemic risk when many drives share a few controller suppliers. An OEM whose whole line runs on one third-party controller is exposed if that vendor faces capacity limits, silicon shortages or a quality event, so procurement teams build multi-sourced designs or qualify a second source before they need one. For drives from the smaller vendors, the practical question for procurement and field engineers is how much you know about the supply and support behind the drive.
Firmware tuning is the less visible differentiator. Say two OEMs ship the same Phison-based platform on the same NAND. One tunes its firmware to keep the SLC cacheAn SLC cache writes incoming data first in a fast one-bit-per-cell mode, then folds it into denser TLC or QLC cells when the drive has time. small and fold it early, and holds consistent performance under sustained random writes. Its rival tunes for peak benchmark numbers, bursts faster and collapses sooner. The same silicon and NAND can behave differently under sustained random writes because of the firmware.
What the controller hands to the flash translation layer
Part 6 starts from three facts about this chip. They are how many channels and dies it can keep busy, which jobs the hardware engines already handle at line rate, and which decisions the silicon leaves to firmware. Die collisionsA die collision happens when two commands need the same die and one has to wait. A deeper queue spreads work over more dies and so lowers collisions. decide how much of the channel ceiling a queue can use.
On a real drive, that shows up as sustained speed that tracks the populated channels and dies, tail latency that rises as commands collide on a die, and a first-I/O delay after a deep idle. Knowing which controller is inside tells you where to look first when one of those misbehaves.
What the controller hands to the flash translation layer
Silicon sets the ceiling, firmware spends it
What the controller fixes and what firmware decides
Figure 5.13 splits the chip’s resources the same way. The silicon fixes the ceiling and the engines, and everything that is policy sits in firmware that a release can change. Both arrive together at the flash translation layer.
What the controller hands to the flash translation layer
The Controller feeds 2 later parts.
Arrows run to the parts that build on this one.
Part 6 builds on this silicon. It covers the firmware the cores run most of the time (the flash translation layer), which keeps the logical-to-physical mapThe logical-to-physical map needs about 4 bytes for every 4KiB of data, which works out to about 1GB of map for every 1TB of capacity. that turns a write-once medium into rewritable storage, and what happens to that map when power fails.
Sources
Primary is the original paper, standard or datasheet. Secondary is a review, a vendor summary or a news report. Measured is my own test data.
Show all 68 sources, 50 primary
- PrimaryLittle's Law (Little and Graves, Building Intuition chapter 5)Springer, copy hosted by UCSD, 2008
- PrimaryMicron TN-29-19, NAND Flash 101 (Rev. B, 2010)Micron Technology, Inc., 2010
- PrimaryToshiba Introduces Double Data Rate Toggle Mode NAND in MLC and SLC Configurationsprnewswire.com, 2010
- Primary19nm 112.8mm2 64Gb Multi-level Flash Memory with 400Mb/s/pin 1.8V Toggle Mode Interface (FMS 2012 slides, Shibata)Toshiba (N. Shibata), Flash Memory Summit 2012 proceedings, via Internet Archive, 2012
- PrimaryMarvell 88SS1092 Flash Memory ControllerNVMe, 2017
- PrimaryArchitectural Techniques for Improving NAND Flash Memory ReliabilityCarnegie Mellon University (PhD thesis), 2018
- PrimaryPC SN730 NVMe™ SSDWestern Digital, 2019
- PrimarySelf-encrypting deception: weaknesses in the encryption of solid state drives (SSDs)IEEE Symposium on Security and Privacy 2019
- PrimaryYeap et al., 5nm high-density SRAM cells (IEDM 2019, Crossref record)IEDM 2019
- PrimarySilicon Motion SM2267/SM2267XT: product briefNVMe, 2020
- PrimaryInternational Roadmap for Devices and Systems 2022 Edition: More MooreIEEE IRDS, 2022
- PrimaryMicron Ships World's First 232-Layer NAND, Extends Technology LeadershipMicron Technology, Inc., 2022
- PrimaryNVMe Technology Power Features (NVM Express)NVM Express - scalable, efficient, and industry standard, 2022
- PrimarySamsung 990 PRO Series SSDs Will Be Available for Pre-Order on November 1stSamsung Electronics America, 2022
- PrimarySamsung begins mass production of 8th-gen V-NAND, Toggle DDR 5.0 editor noteSamsung, 2022
- PrimaryONFI 5.2 specificationONFI, 2024
- PrimaryISSCC 2025 paper 30.5 (SK hynix 321-layer 2Tb QLC), Fig. 30.5.6 key parameter table, transcribedIEEE (ISSCC 2025, paper 30.5), 2025
- PrimaryKioxia and Sandisk ISSCC press releaseKioxia, 2025
- PrimaryKioxia Exceria Plus G4 2TB Gen 5 SSD ReviewKitGuru, 2025
- PrimarySilicon Motion Announces SM8388 PCIe Gen5 8-Channel Enterprise SSD ControllerSilicon Motion (PR Newswire copy of the release), 2025
- PrimaryDesign Tradeoffs for SSD PerformanceUSENIX
- PrimaryGet-StorageReliabilityCounter (Storage)Microsoft Learn
- PrimaryInnoGrit IG5220 (RainierQX) product brief (ssd-tester.de mirror)InnoGrit (mirror hosted by ssd-tester.de)
- PrimaryJEDEC JESD230D: NAND Flash Interface InteroperabilityJEDEC
- PrimaryLinux commit c5552fd: nvme: Enable autonomous power state transitionsGitHub (torvalds/linux)
- PrimaryLM10504 Triple Buck and LDO Power Management UnitTexas Instruments
- PrimaryMarvell Bravera SC5 MV-SS1331/MV-SS1333 product brief (text of the saved PDF)Marvell
- PrimaryMarvell Introduces Bravera SSD Controllers to Enable the Highest Performing Data Center Flash Storage SolutionsMarvell Technology, Inc.
- PrimaryMaxio MAP1202 product brief (ssd-tester.de mirror)Maxio (mirror hosted by ssd-tester.de)
- PrimaryMurata crystal units for SSD controllers (reference table)Murata
- PrimaryNIST SP 800-88 Rev. 1: Guidelines for Media SanitizationNIST
- PrimaryNVM Express Base Specification, Revision 1.4cNVM Express
- PrimaryNVM Express Management Interface 1.0 (gold)NVM Express
- PrimaryNVME_HEALTH_INFO_LOG - Win32 appslearn.microsoft.com
- PrimaryONFI 4.2 specification (excerpts)ONFI
- PrimaryONFI specificationsONFI
- PrimaryOpen NAND Flash Interface Specification, Revision 6.0ONFI
- PrimaryPhison E28 PCIe Gen5 SSD controllerPhison Electronics
- PrimaryPhison PS5018-E18: controller specificationssd-tester.de
- PrimaryPower measurement: what sample rate do I need?Quarch Technology
- PrimaryQorvo Enterprise Solid State Drives: solutions guideQorvo
- PrimarySamsung Electronics Brings Next Wave of High-Performance Storage with Mass Production of Fifth-generation V-NANDSamsung Electronics
- PrimarySeparate Reference Clock with Independent SSC (SRIS), Intel 600 Series Chipset PCH datasheetIntel
- PrimarySilicon Motion SM2258XT: product briefSilicon Motion
- PrimarySilicon Motion SM8366 MonTitan PCIe Gen5 SSD Solutions Platform: product briefSilicon Motion
- PrimaryTCG Storage, Opal, and NVMe (NVM Express and TCG joint white paper)NVM Express and Trusted Computing Group
- PrimaryTPS543B20 synchronous step-down converter datasheetTexas Instruments
- PrimaryTPS56637 datasheet (Texas Instruments)Texas Instruments
- PrimaryUS 5,864,504: Nonvolatile semiconductor memory with temperature compensation for read and verify referencingGoogle Patents
- PrimaryZNS: Avoiding the Block Interface Tax for Flash-based SSDs
- SecondarySamsung and Toshiba to Support New Standardized NAND Specification for High-performance ApplicationsToshiba/Samsung (hosted by KIOXIA), 2010
- SecondaryPCI-SIG SR-IOV Primer: An Introduction to SR-IOV TechnologyIntel Corporation, 2011
- SecondaryActive-State Power Management, Power Management Guide, RHEL 7Red Hat, 2019
- SecondaryNVMe PCIe SSD M.2 2280 Manual, PSFNP5xxxx5xxx Rev CViking Technology, 2019
- SecondaryHardware Debugging for Reverse Engineers Part 2: JTAG, SSDs and Firmware Extractionwrongbaud blog, 2020
- SecondaryNot-So-Solid State: SSD Makers Swap Parts Without Telling UsTom's Hardware, 2020
- SecondaryEnmotus FuzeDrive P200 M.2 NVMe SSD Review: AI Storage Beats SSD CachingTom's Hardware, 2021
- SecondarySamsung 980 Pro M.2 NVMe SSD Review: Redefining Gen4 Performance (Updated)Tom, 2021
- SecondaryPhison Announces New PS5026-E26 Controller Firmware after Testers Discover PCIe 5.0 NVMe SSDs Failing in Less Than 3 Minutes without Proper CoolingThe FPS Review, 2023
- SecondarySamsung begins industry first mass production of 9th-gen V-NAND, Toggle 5.1Samsung, 2024
- SecondarySamsung 9100 Pro SSD Review: Samsung’s Capable Answer to Phison’s Storage GauntletTom's Hardware, 2025
- SecondaryBoot ROM and Security for Enterprise SSDs - SK Hynix - StorageNewsletterstoragenewsletter.com
- Secondarycongatec AN45: PCI Express Reference Clock Designcongatec.com
- SecondaryError Characterization, Mitigation, and Recovery in Flash-Memory-Based Solid-State Drives
- SecondaryPhison E26: PCIe 5.0 controller to deliver 2x faster NVMe SSDsHWCooling.net
- SecondaryPhison NVMe PS5000-Series Controller RecoveryRossmann Repair Group
- SecondaryTechnology power features (NVM Express)NVM Express
- MeasuredThe author’s own measurements