There’s a kind of story that travels through engineering circles, not the sort that makes a press release, but the kind people retell years later with equal parts respect and disbelief. It usually starts with someone trying a scenario no one thought to simulate and ends with a design team watching their flagship behave in ways the models never predicted.
Lab Notes
The “All-at-Once” Failure
A 24-drive RAID 0 experiment exposes a synchronized failure that individual-drive tests missed, and challenges what validation should cover.
On this page 13 sections
This is one of those stories. It’s about the time I collapsed the throughput of a high-end enterprise controller by thinking like an enthusiast, and, in doing so, turned a near-disaster into a firmware fix and a lesson I still use. It sits in the gap between how hardware is supposed to be used and how it can actually be abused. It began, as these things often do, when I asked myself a simple question. “What happens if I just push it further?”
A CES booth and a testbed under a bed
Brute-force parallelism, unleashed: a CES epiphany
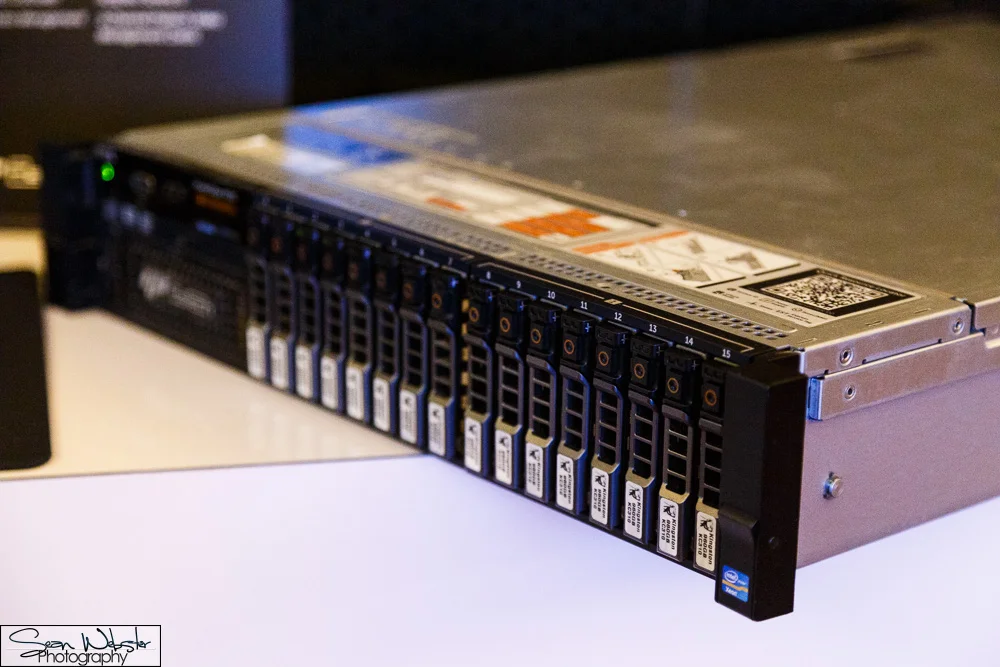
Years ago at CES, standing at a display booth showcasing live-capture rigs, I watched a commercial audio-video systems demo that planted a seed. One of Kingston’s partners ran enormous SATA enclosures (16+ drive arrays of Kingston KC310 SATA SSDs) designed to swallow uncompressed 4K video streams in real time. These weren’t your run-of-the-mill data-center appliances but brutal, purpose-built machines optimized for raw speed.
Fans howled and LEDs rippled like traffic lights in a storm. One technician, half proud and half tired, mentioned offhand, “We’re hitting gigabytes per second sustained across the full drive set.”
What struck me wasn’t just the speed. It was the philosophy of total engagement, brute force flash parallelism with every SSD active, no flash sleeping, and the volume striped across the entire chassis. That booth moment left me wondering what happens when enterprise composure meets enthusiast-grade aggression.
The setup: building a testbed under a bed
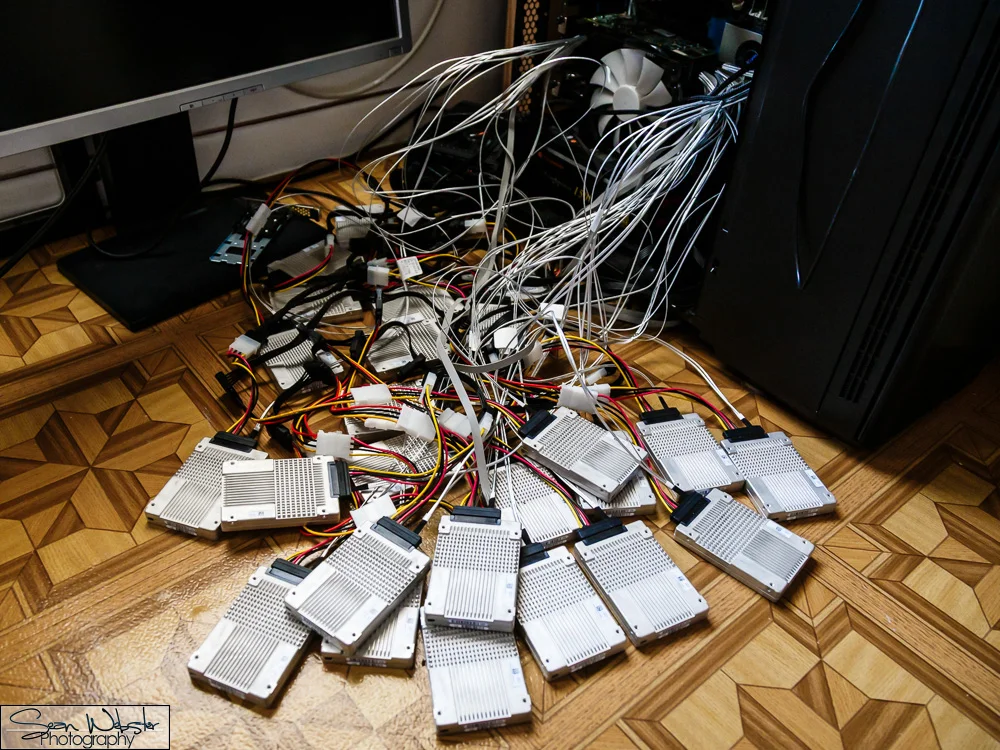
Months later, that question took form in my unofficial enterprise test lab. It was not a rack but a chaotic heap of electronics jammed beneath a bed. Outside a makeshift workstation tower, LEDs washed the frame in green. Drives dangled at improbable angles, cables sprawled like vines, and a box fan roared cold air across the chaos.
Zip ties tried, and failed, to impose order, grouping clusters of cables and drives into rough alignments that hinted at refinement but surrendered to entropy. This was no corporate clean room, just roughly $100,000 worth of functional madness, by my recollection, fighting to earn a name in storage validation.
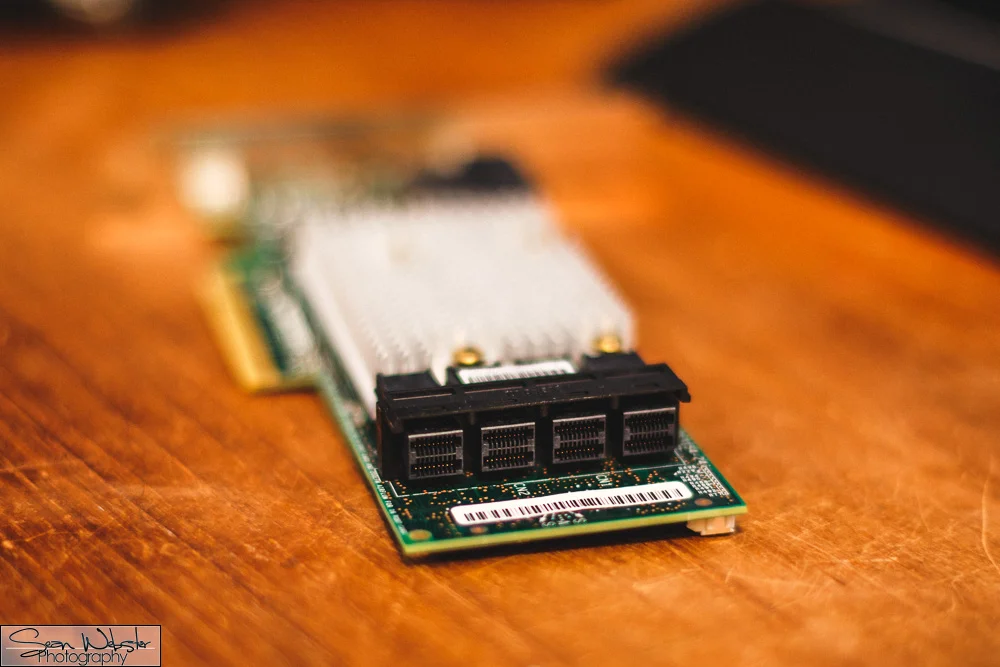
At the core sat a next‑generation enterprise storage controller card from a vendor known for stitching together the connective tissue of modern storage. This board blurred boundaries (endpoint meeting fabric), an early hint of the logic that would later define PCIe fabric switches and composable infrastructures.
Hardware specs
The 4GB cache and PCIe 3.0 x8 link below are from my memory of a pre-release card, not from a datasheet.
- PCIe 3.0 x8 interface (~7.9GB/s per direction, per the Xilinx PCI Express white paper)
- 12Gb/s internal mini-SAS HD ports (SFF-8643)
- 4GB DDR4 cache (massive for the time)
- 4Kn native sector size (perfect RAID 0 stripe alignment), listed in the SmartRAID 3100 product brief
- Firmware with dynamic per-port queue allocation, power-state aware arbitration, adaptive dampening for mixed workloads
- Designed for data center politeness: drives waking randomly, never all at once
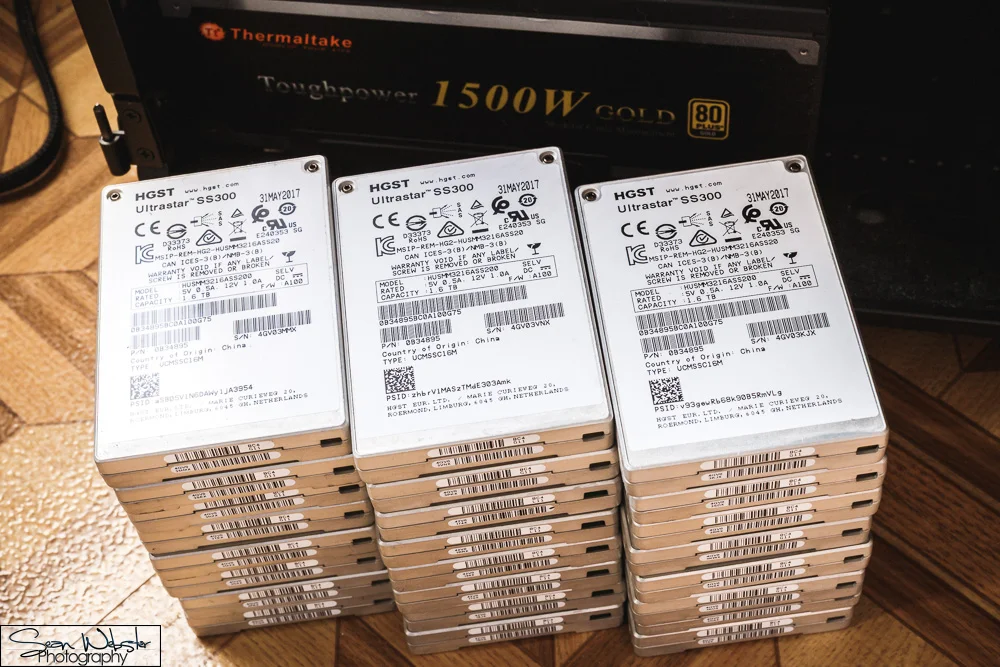
HGST sponsored twenty-four enterprise-grade Ultrastar SS300 3.2TB SSDs for the drive array, listed in the Western Digital data sheet:
Drive specs
- 12Gb/s SAS interface
- 10 DWPD endurance rating
- Enterprise MLC NAND
- Up to 400K read and 200K write IOPS, ~2.1GB/s sequential per drive
- ~$4,000 each, as I recall
From memory, the array peaked at about 1.2M IOPS across all 24 drives, though the test settings behind that number are not recorded here.
Raw potential came to 24 × 2.1GB/s = ~50GB/s, capped by the controller’s PCIe x8 interface.
A CES booth and a testbed under a bed
Twenty-four drives add up to far more than the link can carry
Sequential throughput of one SS300 drive, the 24-drive sum, and the controller’s link
I pieced together everything else through both effort and outreach, including the platform, chassis, cooling, and Quarch power instrumentation.
Pushing one volume past the envelope
The experiment: one volume to rule them all
This silicon was beautiful, cutting-edge for its generation, built around dense lane aggregation and power-aware scheduling, with isolation logic tuned for multi-tenant efficiency.
On paper, it all made sense. Their design assumed a polite world of normal mixed workloads, staggered activity, and distributed demand. In their validation runs it behaved flawlessly, with balanced RAID levels, moderate queue depths, and well-groomed topologies, which made it predictable, efficient, and honestly a little boring.
But I approached this analysis as both an engineer and an enthusiast, chasing a simpler, riskier question of how far it could really go beyond “normal.”
My idea was straightforward. I tested the controller and array nearly every way possible. I scaled one drive to 24 in all RAID and non-RAID configurations, testing each for optimal operation.
I built the drive arrays and executed, sweeping across:
- Stripe sizes
- Queue depths and thread counts
- Read/write and block size mixes
- Background activity and steady-state runs
I wasn’t trying to make it fail. I wanted to map the entire performance envelope, from polite workloads up to full-throttle saturation.
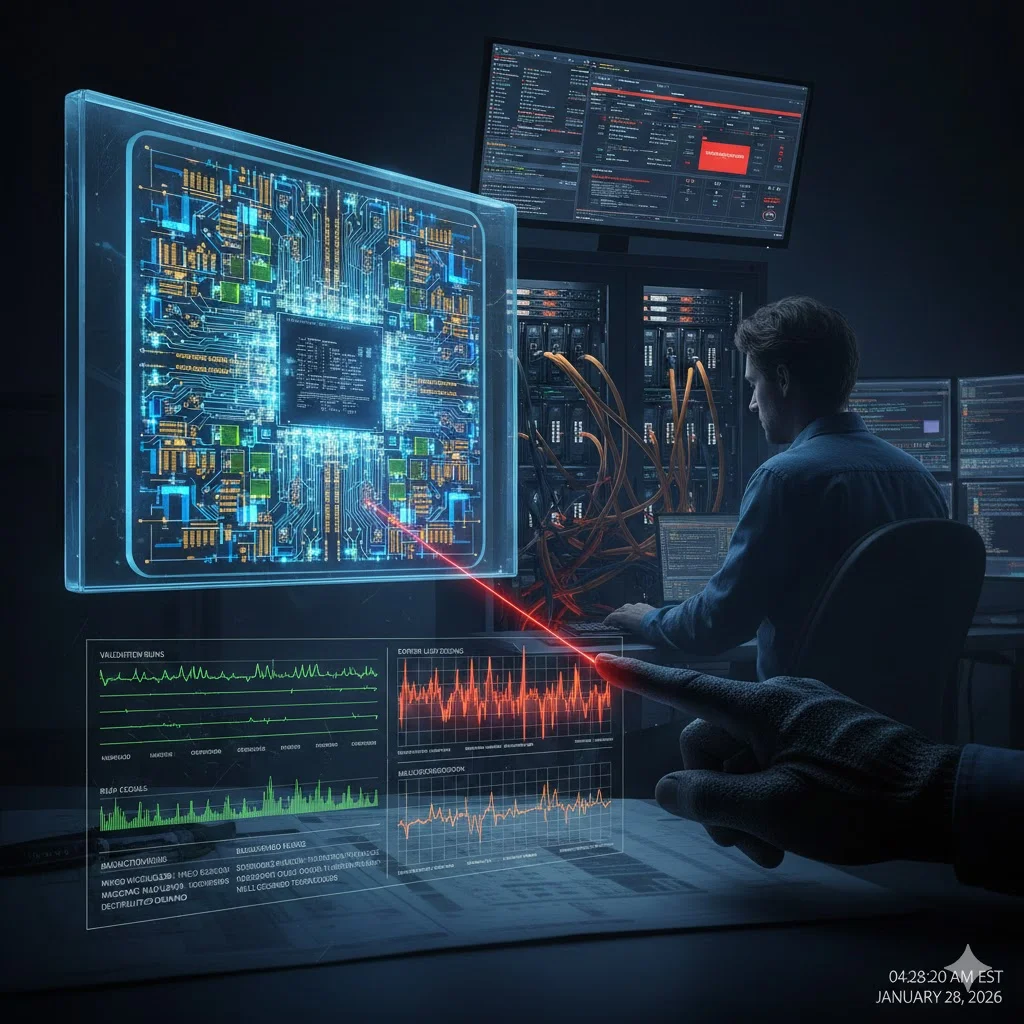
In consumer use, one configuration mattered most: the dream of a monster RAID 0 spanning every available drive, built purely for peak throughput. Consumer enthusiasts call it a brag and amass absurd sequential screenshots. Enterprise architects call it a nightmare, because one coordinator hiccup means total collapse.
That thought lingered through midweek testing, and by the next, the irony would reveal itself. At first the performance curves were so beautiful they were almost frightening. In my run, throughput scaled nearly linearly as each drive joined the workload, until the array neared its limit. The more I pushed, the better it looked.
Pushing one volume past the envelope
Throughput climbed with every drive, then fell with all 24 active
The shape of the result: a stripe grown from one drive to 24
And then it happened. During a RAID 0 sweep, the HBA couldn’t keep up and performance tanked.
Just as the array approached its theoretical limit, something odd happened. Scaling didn’t flatten the way it should have. It collapsed. Did a drive die? Had a cable failed from a loose connection? I had no idea yet what was going on.
There was no dramatic crash, no kernel panic, and no red lights. Throughput simply fell off a cliff. Drives remained online. Links stayed negotiated. Temperatures were under control. Host CPU and memory had headroom. Nothing obvious was “wrong,” and yet the array was now performing like a much smaller, weaker system.
That’s the moment in any investigation when you have to decide whether to blame it on “test flakiness” or to assume the system is telling you something subtle and keep digging. I chose the latter.
The invisible failure: when synchronization becomes a bug
Reproducing the behavior confirmed it wasn’t a fluke. The collapse:
- Happened only when all 24 drives were fully engaged in a single striping pattern
- Was strongly correlated with maximum concurrency, when every channel and every queue went fully active at once
- Recovered partially if I backed off the load, but never returned to the pristine behavior seen before
From the outside, it looked like internal throttling or a hidden limit. But it didn’t match any of the usual suspects:
- Not host saturation
- Not link-level retrains
- Not thermal throttling
- Not a single misbehaving drive pulling the array down
Everything pointed to a coordination fault inside the controller. Instrumentation showed a clear pattern. When all 24 drives ramped up in perfect sync, performance collapsed.
Tuned for staggered activity, the controller’s firmware didn’t know how to handle total synchronization. Its power management and scheduling logic over‑corrected, so what was harmony under normal conditions became gridlock at full concurrency.
In my reading, power transitions and queue arbitration in the firmware were getting in each other’s way, so the controller gridlocked while the drives themselves kept steady.
From dismissal to a firmware fix
The pushback: “No real customer would do that”
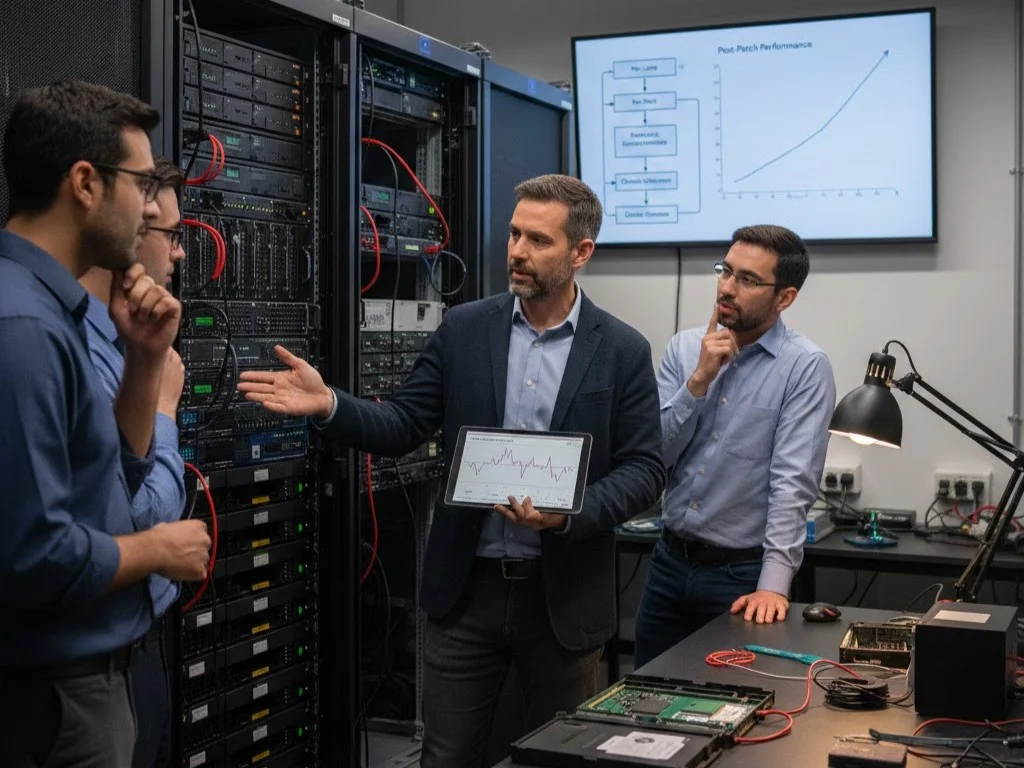
When I brought this to the vendor, the initial reaction was exactly what you’d expect:
“No production deployment would ever hit all 24 drives like that at the same time.”
From an enterprise architect’s point of view, that’s defensible. Most sane deployments would use multiple arrays, mix RAID levels, and stagger workloads. But validation has to cover the edges of possibility as well as sane behavior.
Once I showed them the Quarch HD PPM traces (the empirical power and performance data), the tone changed immediately. They were no longer speculation but evidence of a genuine synchronization problem deep in the controller’s transient response and queue coordination logic.
We spent the next several weeks going back and forth. Fixing it took more than a one-line patch, because it required rethinking how per-lane and per-port behavior cooperated with the global scheduler, and how the controller should behave when every downstream device demanded attention simultaneously. Months later, a new firmware revision was released. Regression testing now includes “everything at once” scenarios that hadn’t been there before.
From dismissal to a firmware fix
A dismissed report became a firmware fix after the traces came out
From the first report to the retest
After the patched revision arrived in my lab, the same 24-drive test scaled linearly in my run, up to the controller’s limit. There was no collapse and no oscillation.
The invisible story behind the fix
What began as a straightforward performance review turned into an unexpected side quest that ended in a new firmware revision for that controller. That firmware revision showed clear, measurable improvement, yet the story behind it was never published.
My review stayed unpublished, but what it showed held up. I’d learned how easily real systems can be pushed beyond their assumptions, and how that abuse can make the entire fabric smarter once it’s understood.
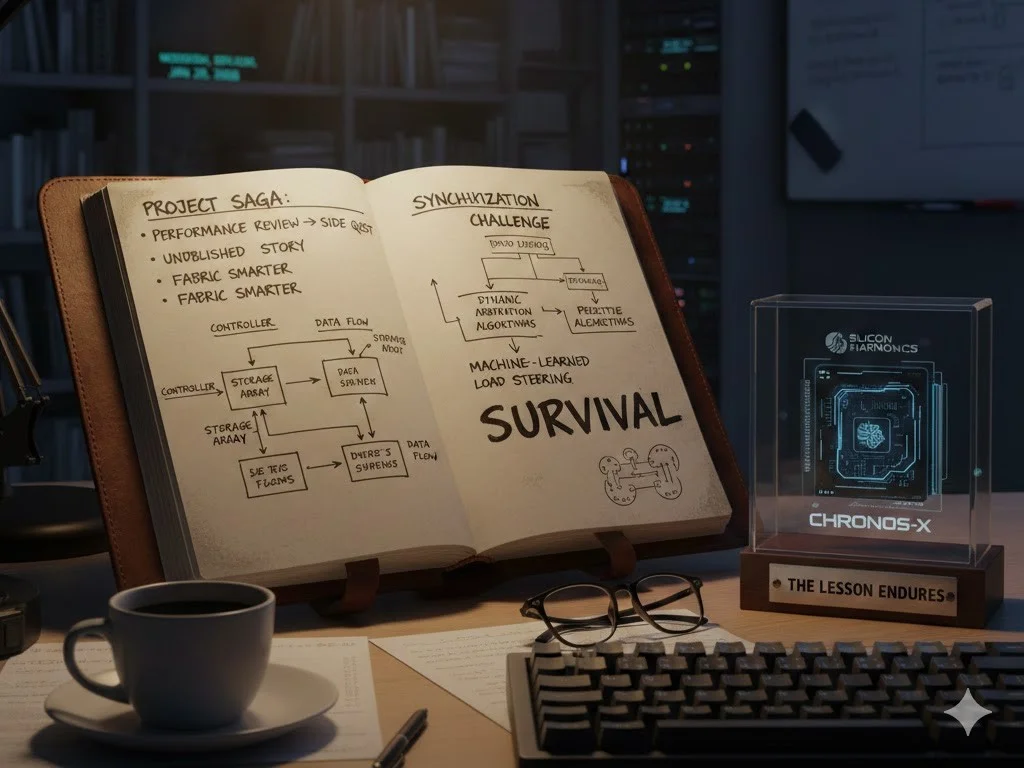
That controller family went on to power serious storage deployments. Today’s multi-root fabrics have evolved the same coordination challenge I once ran into, which is how to maintain order when every device shouts at once. New controllers solve it through dynamic arbitration, predictive algorithms, and machine-learned load steering, yet the principle remains survival under synchronization.
What this taught me
That 24-drive RAID 0 test changed how I define validation.
Most organizations treat validation as verification of conformance:
- Does it meet the spec?
- Does it behave under modeled workloads?
- Does it pass all the checklists?
Those are necessary questions, but they’re not sufficient. Real validation is system integrity exploration, and it asks different questions:
- What happens when you push past the expected envelope?
- How does the architecture behave at the edges of concurrency and coordination?
- Where do design assumptions drift away from physical reality?
What this taught me
Conformance tests stay inside the envelope, integrity tests go beyond
Where each kind of validation puts its tests
That experiment crystallized a few principles I still lean on today:
- Power behavior, scheduling policy, and data flow are inseparable. Power orchestration is data orchestration, and every micro-watt state change echoes through I/O behavior.
- Curiosity fuels innovation. Many architectural breakthroughs start with someone pushing too far.
Those quiet hours beside that humming system taught me more about patience and pattern recognition than any lecture could. Every fan’s whisper, every flicker of LED, was a dialogue between expectation and reality. When performance collapsed, I was fascinated rather than frustrated, because I’d found where theory cracked.
It also taught empathy for hardware. You begin to listen differently once you realize a controller’s odd rhythm tells you more than any log file. That intimacy built intuition, and humility. It didn’t fail out of weakness. It slowed down as if to protect itself from the impossible environment I had created, and there’s something deeply human about that.
The philosophy
Looking back, it’s funny that one loud, expensive machine running under a bed helped change how that controller’s firmware handled concurrency. That array is long gone now (its parts recycled into quieter projects), but its lessons persist.
Whenever I evaluate modern fabrics or SSD controllers, I still think of that chassis glowing softly in the dark. Progress is always a balance of opposites, such as efficiency against force, elegance against audacity, and theory against curiosity, and that test sat where they collide.
The philosophy
Validation lives where steadiness and pressure meet
Three pairs of opposites and the point where they collide
You don’t need an EE degree or a corporate badge to discover meaningful flaws in complex systems. You need:
- The willingness to test what no one would ever do
- The patience to separate symptoms from causes
- The stubbornness to treat strange behavior as a clue, not noise

If you want systems that hold up, you can’t only design for how they should be used. You have to learn from how they could be used, especially when everything, everywhere, runs all at once.
Sources
Primary is the original paper, standard or datasheet. Secondary is a review, a vendor summary or a news report. Measured is my own test data.
Show all 3 sources, 1 primary
- PrimaryWestern Digital Ultrastar DC SS300: data sheet (maker copy)Western Digital
- SecondaryXilinx WP350: Understanding Performance of PCI Express Systems
- MeasuredThe author’s own measurements