Lab Notes

The Visionary of PCIe 5.0

A reflection on PCIe Gen5 validation, where cooling, sustained workloads, and controller limits complicate the promise of higher bandwidth.

On this page 3 sections

At the start of the Gen5 era, most reviewers focused on the numbers on the box. I wanted to know what the physics under those numbers would do to them: how hot controllers and PHY layers get, and whether a drive holds its speed once the load keeps going. This reflection is what I mapped out during Gen5 validation and how I judge a drive from it, by how long it stays fast. The figures are schematic and carry no measured values. The first Flash Foundations part comes back to the same thermal gap when it reaches Gen5, and Every NVMe SSD Needs a Heatsink tests when cooling matters, with a model and my bench.

Gen5 speed on the box, under load and over the hoursA three-panel cover, no values. Left: a single tall bar for the peak bandwidth on the box. Center: a line that stays level and then falls, for a Gen5 controller and PHY under sustained load. Right: a solid line that stays level and a dashed line that steps down, for a drive that holds its speed and one that throttles over the hours.LAB NOTES / PCIE GEN5How long the speed lastsTHE BOX · UNDER LOAD · THE HOURS01 THE BOXPeak bandwidthon the box02 UNDER LOADHeat on controllerand PHY03 THE HOURSHolds, or throttlesover the hours

The physics behind the promise

As the industry braced for the leap to PCIe Gen5, most reviewers focused on peak bandwidth and record-breaking throughput. I meanwhile looked deeper, beyond the specifications, at the physics that would limit even the boldest claims. Under sustained load, Gen5 controllers and PHY layers run hot and the drive slows.

The physics behind the promise

Sustained load heats the controller and PHY, and speed falls

A left-to-right flow of three boxes joined by copper arrows: Sustained load, Controller and PHY run hot, Speed falls under load. Below, a row of four boxes, Heatsinks, Quality tracing, Dynamic airflow and Smarter power gating, joined by a bracket and a dashed line up to the middle box, showing that these four act on the heat.01Sustained load02Controllerand PHY run hot03Speed fallsunder loadWHAT I SAID A DRIVE NEEDSHeatsinksQualitytracingDynamicairflowSmarterpower gatingPath of the problemWhat the drive needsResult
Figure 1 · Why Gen5 drives flounder under sustained load, and the four things I said they need to keep their speed. Illustrative values.

Long before retail boards reached store shelves, I had already mapped out the thermal limits. I warned that Gen5 would push controllers and PHY layers to their breaking point, that without proper heatsinks, quality tracing, dynamic airflow, and smarter power gating, even the most expensive drives would flounder under sustained load.
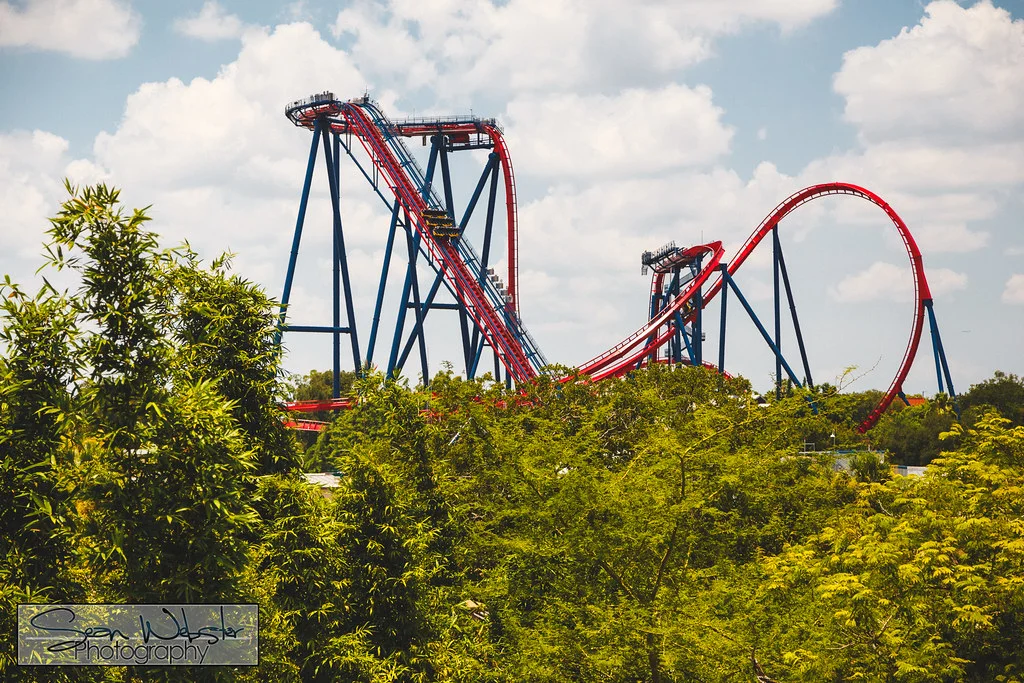
Red roller coaster track on blue support towers rising above green trees under a partly cloudy blue sky.

Performance that lasts

When I evaluate a drive, I don’t ask how fast it is today. I ask how long it will stay that way.

Performance that lasts

I judge a drive by how long its speed lasts

A schematic plot of speed over time under sustained load, with no values. Two lines start at the same speed. A solid teal line stays level for the whole run. A dashed neutral line stays level briefly, then steps down and stays low. A dashed vertical mark labeled Today sits near the start, and a double-headed arrow under the lines spans the rest of the time axis, labeled How long it stays that way.Speed (relative)Time under sustained loadTodayHow long it stays that wayHolds its speedThrottles under load
Figure 2 · Two drives that start at the same speed under sustained load: one holds it and one does not. The lines show shape only. Illustrative values.

My verdicts extend beyond a product. For Gen5 they ask where the technology must evolve to survive in real-world conditions, starting with heat.

Marketing accolades and review scores don’t measure what I care about. Professionals, gamers, and data centers have had stable, high-speed hours from systems built on my guidance.

Close-up of polished stones and rough crystals in purple, orange, yellow and red, piled across a dark curved tray.

A longer view of Gen5

One industry peer said I don’t just look at the specs on the box.

A longer view of Gen5

I document what is, and what must come next

Three equal panels. The first, The box, shows a single tall bar for peak bandwidth. The second, Under load, shows a line that stays level and then falls, for heat and power under sustained load. The third, Next, shows a dashed stepped line rising, for what the technology must change. The first two panels are teal, for what is documented; the third is neutral and dashed, for what must come next.01 THE BOXSpecs on the boxPeak bandwidth02 UNDER LOADSustained loadHeat and power03 NEXTWhat must evolvein real-world useWhat isWhat must come next
Figure 3 · Three views of a Gen5 drive: the specs on the box, its behavior under sustained load, and what the technology must change to survive real-world conditions. Illustrative values.

For Gen5 and the generations to come, I will keep documenting what is, beginning with whether a drive holds its speed under sustained load, and what must come next.


Sources

Primary is the original paper, standard or datasheet. Secondary is a review, a vendor summary or a news report. Measured is my own test data.

Show all 1 sources
  • MeasuredThe author’s own measurements