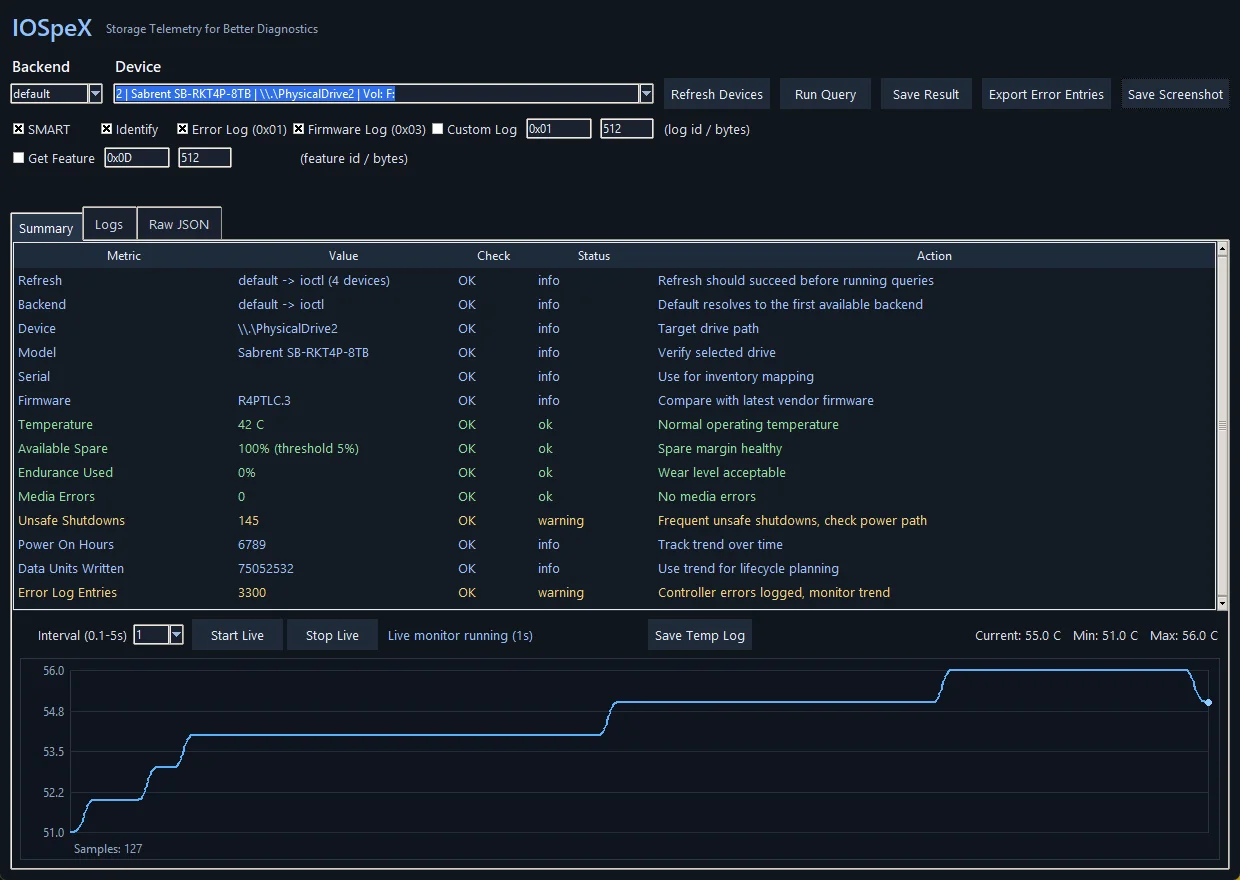
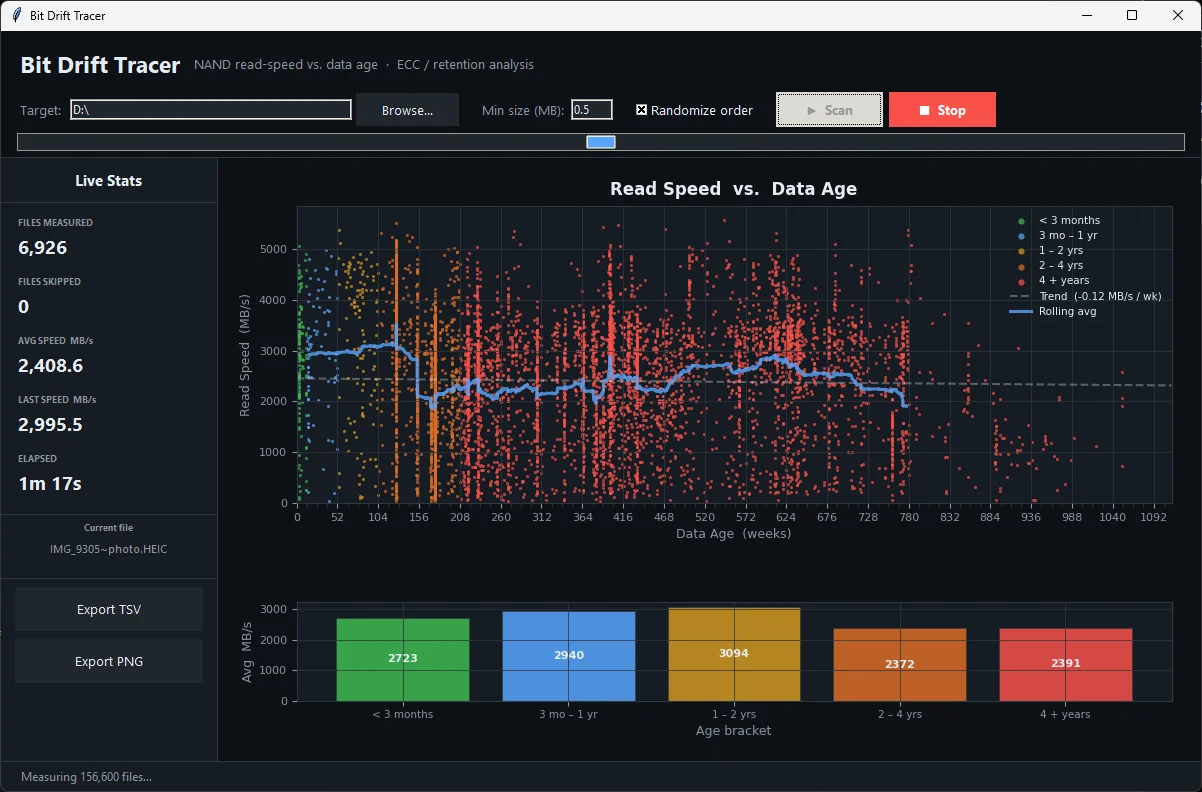
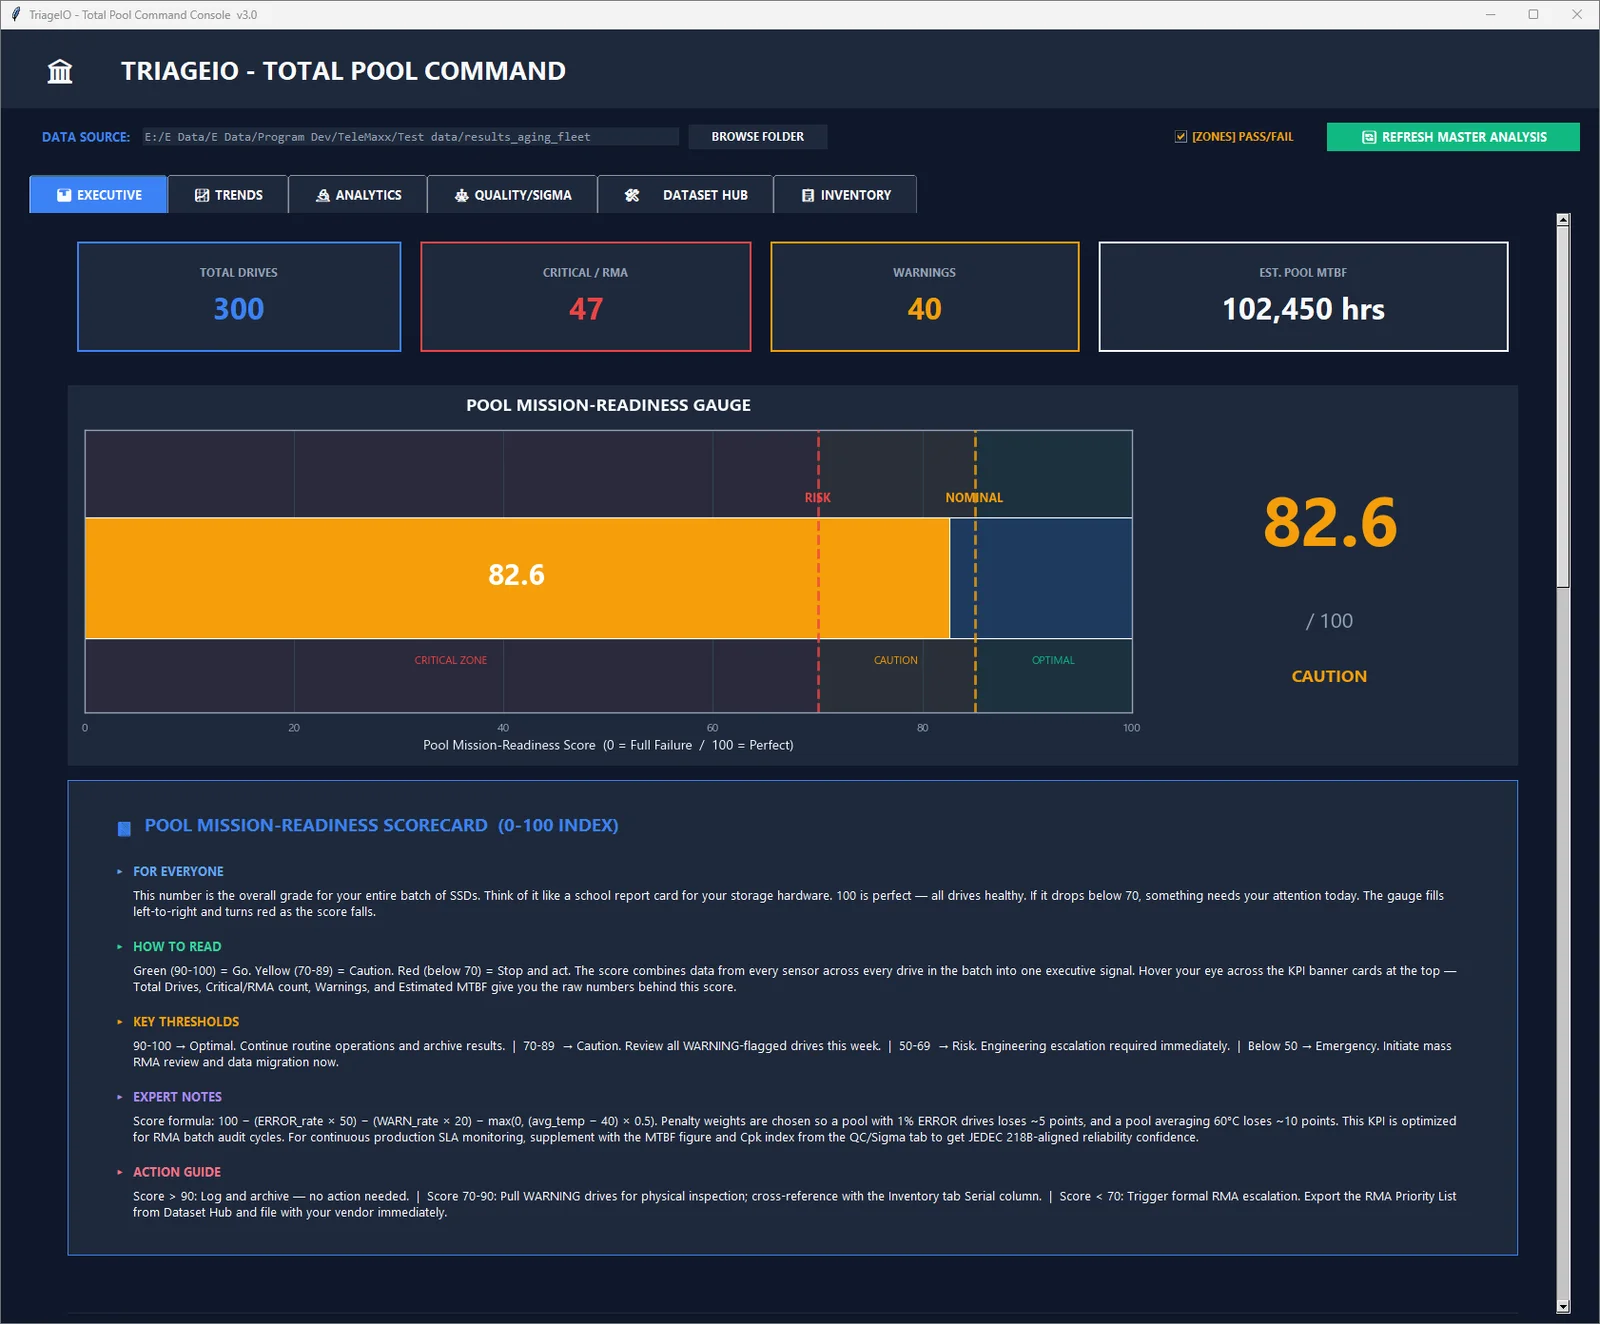
ioTraX is a small Windows program I wrote to show what your storage is doing right now. It draws live charts of throughput, average latency, average I/O size and IOPS for every physical drive in the machine, and it can log each drive to its own CSV file. A benchmark from SSD Benchmarking 101 hands you a result, and this shows the shape of the run behind it. For fleet telemetry and NVMe diagnostics, see its siblings TriageIO and IOSpeX.
Introducing ioTraX
Why it exists
When a run comes back slower than expected, ioTraX lets you ask questions about its shape:
- Are latency spikes constant, or do they come in bursts?
- Are reads or writes driving the latency I see?
- Does the average I/O size say the workload is sequential or random?
- Does the throughput dip line up with a latency rise?
What it shows
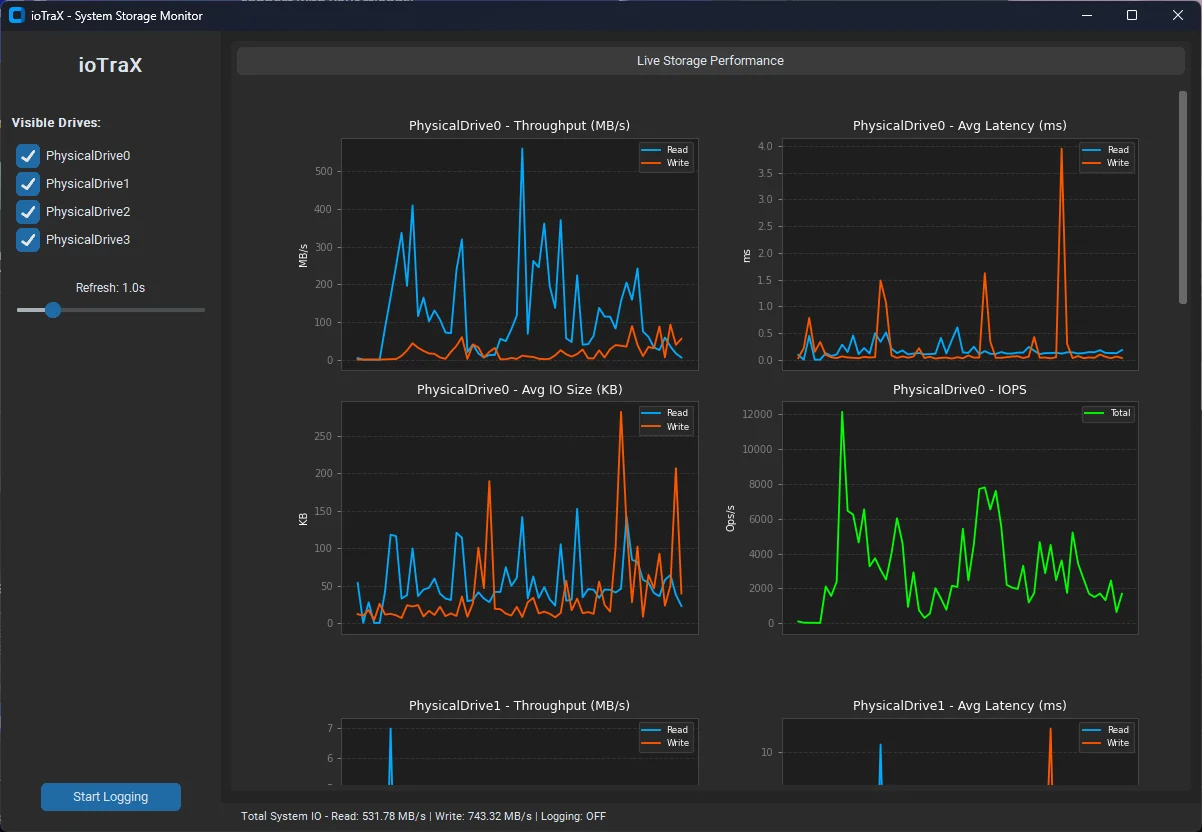
Every physical drive gets a block of four charts, each with a read line and a write line where that makes sense:
- Throughput, from the change in bytes transferred over the sample interval.
- Average latency, shown in ms.
- Average I/O size, bytes per operation. Large values point to sequential work, and small values point to random access.
- IOPS, reads plus writes combined, in operations per second.
In the sidebar, each drive has a checkbox to show or hide it, and there is a refresh slider from 0.1s to 5.0s (1.0s by default) and the logging button. Total read and write throughput across the visible drives, and whether logging is on, appear in the status bar. Each chart holds the last 60 samples.
The program labels throughput MB/s and I/O size KB, but it divides bytes by 1,048,576 and 1,024, so the values are MiB/s and KiB. A MiB is 1,048,576 bytes against 1,000,000 for a decimal MB, so a reading here is lower than the same rate in a decimal-MB/s tool by a factor of 1.048576. The CSV headers below keep the MB/s and KB text.
Where the numbers come from
Operating-system counters are all it reads, and it never touches the drives. Three of the four charts draw on one source, and latency on another.
Throughput, I/O size and IOPS
Throughput, I/O size and IOPS come from the per-disk I/O counters that psutil exposes. On Windows the drives appear as PhysicalDrive0, PhysicalDrive1 and so on, and that is how ioTraX labels them.
Latency
Latency comes from the Windows Performance Data Helper (PDH) counters Avg. Disk sec/Read and Avg. Disk sec/Write, multiplied by 1000. Those are floating-point values, so sub-millisecond latency on an NVMe drive is not rounded away.
If PDH is not available
If PDH is not available, or a drive has no matching PDH instance, latency falls back to the psutil counters: time spent divided by operations completed in the interval. PDH access comes from the pywin32 package.
CSV logging
Start Logging opens a folder picker, then writes one CSV per physical drive, named io_log_<unix timestamp>_<drive>.csv, for example io_log_1740000000_PhysicalDrive0.csv. It logs every detected drive, including any you have hidden from the charts. Values are written at full float precision, and every sample is flushed after each row, so closing or crashing the program does not lose the log. A power cut can still lose the last few rows.
| Column | Meaning |
|---|---|
| Timestamp | Sample time, YYYY-MM-DD HH:MM:SS |
| Read MB/s, Write MB/s | Throughput since the last sample, in MiB/s |
| Read Latency ms, Write Latency ms | Average latency per operation |
| Read Size KB, Write Size KB | Average transfer size, in KiB |
| IOPS | Reads plus writes per second |
Limitations
It shows the drive as Windows sees it
The counters are whole-drive totals. ioTraX can’t say which process or file produced the I/O, and it doesn’t trace individual commands.
Latency is an average
There are no percentiles, which Flash Foundations Part 9 defines, no maximum per interval and no queue depth. A single slow command inside a sample is averaged into the number. For tail latency you need a tool that records the whole distribution.
The drive list is fixed at launch
ioTraX reads the list of physical drives once at startup. A drive attached later doesn’t appear until you restart it.
Drives are labeled by number
You see PhysicalDrive2, not a model name or drive letter, so match them up in Disk Management.
The charts are a live window, not a history
They have no time axis and show only the last 60 samples, so for a record use the CSV.
Windows only
The README lists Windows 10 and 11, and the repository is a single script with no automated tests.
Get started
You need Windows 10 or 11 and Python 3.8 or newer. Install the dependencies, then run the script. Tkinter comes with the standard Python installer for Windows.
git clone https://github.com/TurboStorage/iotrax.git
cd iotrax
pip install psutil matplotlib customtkinter pywin32
python ioTraX.py
You can also download the repository from GitHub as a ZIP instead of cloning it. For accurate counter access, the README recommends an elevated (Administrator) prompt, and the script doesn’t check for it. Then:
- Uncheck any drive you do not want to see.
- Set the refresh interval with the slider.
- Press Start Logging, pick a folder, and run your workload.
- Press Stop Logging to close the files.
Safety
It is read-only
ioTraX reads performance counters. It never reads or writes drive data, never sends a command to a drive, and never changes a setting, and it makes no network connections.
It writes only the CSV files you ask for
Only the CSV files you ask for get written, into the folder you pick. At the default 1.0s interval that is one row per drive per second, so a long session makes long files.
License
ioTraX is open source under the MIT License, copyright 2026 Sean Webster, and its LICENSE file is in the GitHub repository.