Introducing Bit Drift Tracer
Bit Drift Tracer is a small Windows tool that reads real files from a drive or folder, times each read, and plots read speed against how old the file is. It answers a narrow question. On this drive, do files that have been sitting a long time read at a different speed from files written recently?
Why the question is worth asking
Flash stores bits as electrical charge, and charge drifts over time. Drives correct the resulting errors with ECC, and a drive that refreshes old data in the background can rewrite it before the drift matters. If a drive does not refresh, or refreshes rarely, reads of old data can in principle take more correction work than reads of new data, and that could show up as lower speed.
Bit Drift Tracer measures the host-visible side of that idea, which is the read speed you actually get on the data you actually have, and it says nothing about the cause. Read the limitations section below before you draw any conclusion from a graph.
What it does
- Walks a drive or folder and reads every file of at least a minimum size (0.5MB by default, adjustable).
- Uses unbuffered Windows I/O (
FILE_FLAG_NO_BUFFERING) plus the random-access hint (FILE_FLAG_RANDOM_ACCESS), so the read is not served from the Windows file cache and the driver is told not to prefetch neighboring data. - Reads 4MB from a random sector-aligned offset inside each file that is at least 4MB. A file smaller than 4MB is read whole, from the start.
- Records read speed in MB/s, file size, and file age. Age is the earlier of the file’s modified time and its created time, as Windows reports them.
- Discards a result if the read failed, took under 50 microseconds on the unbuffered path, or computed to more than 30,000MB/s, and counts that file as skipped.
- Shows live stats while it runs (files measured, files skipped, average and last speed, elapsed time, current file) and redraws the graph as results arrive.
- Stops on demand and keeps what it has measured.
Randomize order is on by default. It gathers all the paths first, shuffles them, then measures, so the scan does not walk the folder tree in order. With it off, the tool measures each file as it finds it.
Reading the graph
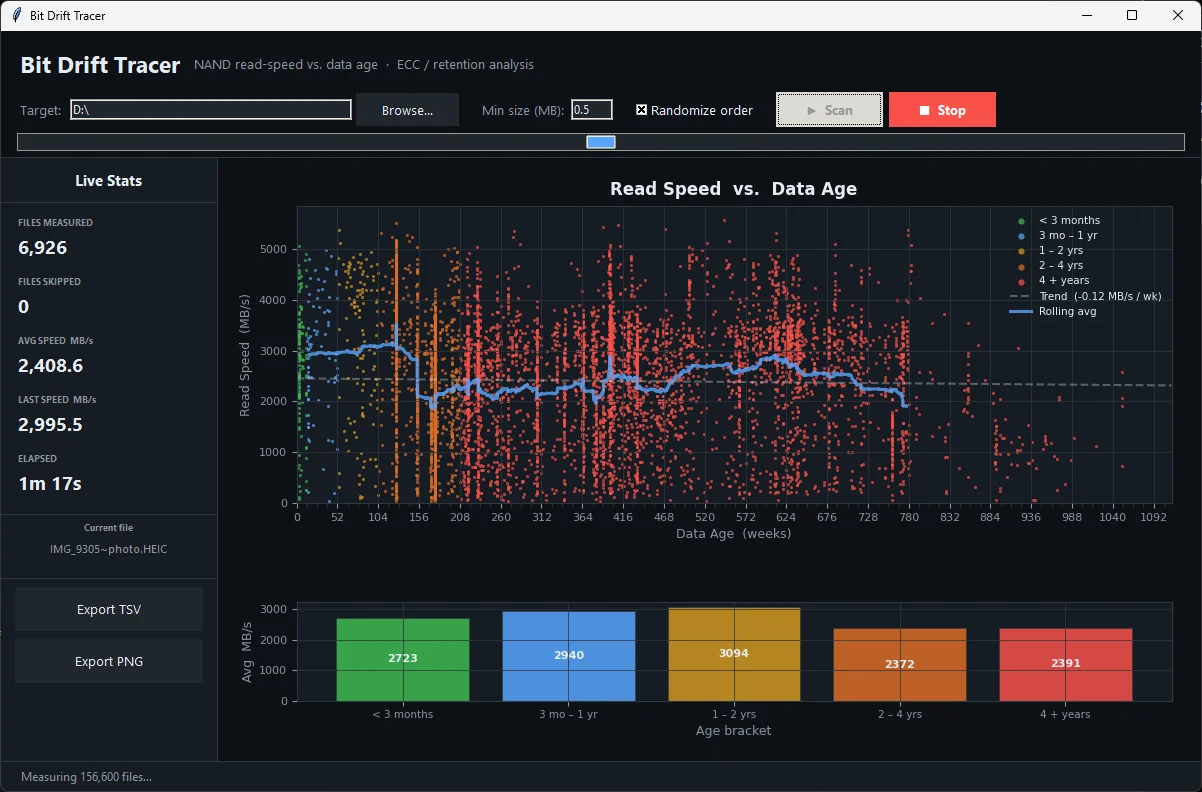
On the scatter plot, file age in weeks runs along the X axis and read speed in MB/s up the Y axis, one dot per file. Dots are colored by age bracket:
| Color | Bracket |
|---|---|
| Green | Less than 3 months |
| Blue | 3 months to 1 year |
| Yellow | 1 to 2 years |
| Orange | 2 to 4 years |
| Red | More than 4 years |
A dashed straight-line fit reports its slope in the legend, in MB/s per week. It needs at least 4 results, and it ignores speeds more than 3 standard deviations from the mean. A solid line is a rolling average, drawn once there are at least 12 results. Below the scatter, a bar chart shows the average speed in each age bracket.
A downward slope means older files were read more slowly in this scan, and the slope alone gives no reason.
An optional log age axis switches the scatter to a log scale from 1 week to 8 years. The trend line then becomes a least-squares fit of read speed against log10(1 + age in days), with its slope in MB/s per decade of age. The linear fit above shows the slope in weeks, and both fits show their R-squared under the controls. The log shape follows what Luo et al. (HeatWatch, HPCA 2018) measured in the 3D NAND chips they characterized: for a fixed dwell time, the threshold-voltage shift is linear in the log of retention time. File age is not retention time, because dwell time and temperature history also change the loss rate.
Why random offsets
Reading only the start of each file is a poor sample. Per the README, Windows Explorer reads file headers for metadata and thumbnails, media players read the first few megabytes on open, and Windows Search indexes file beginnings, so those regions are more likely to have been read recently. Picking a random position inside each large file spreads the sample across the file instead of piling it onto the part that gets touched most.
That is the whole claim. A random offset and an unbuffered read remove some caching effects. They do not guarantee the data came straight from NAND.
Limitations
The repository README is explicit about this, and so should this page be.
It measures host-visible read speed, not NAND
Bit Drift Tracer cannot see cell age, retention state, ECC effort, refresh history or where data is physically placed. A speed difference is a lead worth investigating, not proof of charge loss.
Age comes from filesystem timestamps
Those can be copied, restored, rewritten or defined differently by different filesystems, and they do not tell you when the SSD programmed the data.
Caches can still answer
FILE_FLAG_NO_BUFFERING and the random-access hint reduce OS caching and prefetch, but they cannot guarantee a bypass of the storage driver, a USB bridge, the SSD controller, an SLC cache or DRAM.
One sample per file
Each file gets a single read of up to 4MB, so any one dot is noisy, and the shape across thousands of files carries the information.
Many things move read speed
File size and layout, fragmentation, queueing, background activity, thermal and power state, compression, encryption and controller firmware all change results, so repeat scans and controlled comparisons tell you more than one trend line.
Windows only
Windows 10 and 11 are the only systems the README lists. If the aligned read buffer cannot be allocated, the code falls back to ordinary buffered reads, which the OS cache can serve.
It only sees data already on the drive
The tool compares old files with new ones, so a fresh drive that holds only recent data gives it nothing to compare.
Get started
You need Windows 10 or 11, Python 3.10 or newer, and two packages. Tkinter comes with the standard Python installer for Windows.
git clone https://github.com/TurboStorage/bit-drift-tracer.git
cd bit-drift-tracer
pip install matplotlib numpy
python "Bit Drift Tracer.py"
You can also download the repository from GitHub as a ZIP instead of cloning it. In the window:
- Type a drive root such as
D:\or a folder into Target, or use Browse. - Set Min size (MB) if you want to skip small files.
- Leave Randomize order on unless you want a folder-order scan.
- Press Scan. Stop ends the scan and keeps the results.
- Use Export TSV for a tab-separated file (age in days, rate in MB/s, size in MB, path) and Export PNG for the chart.
Safety
It only reads
Each file is opened with read access only and sharing left open, so the tool does not lock it. The buffered fallback opens files in binary read mode as well.
It writes only what you export
In the code, the only file writes are the two exports. Each goes to the path you pick in the save dialog.
It does not ask for administrator rights
Nothing in the code requests elevation, so it runs under your normal account. Files and folders it cannot read are skipped, and the code imports no networking library.
A full-drive scan is real read load
It reads a sample from every file of at least the minimum size, so a large drive takes a while and competes with whatever else the drive is doing. Run it when the drive is otherwise idle if you want clean numbers.
The TSV lists full file paths
Each row ends with the file’s full path, so strip or anonymize that column before you share the file.
License
Bit Drift Tracer is open source under the MIT License, copyright 2026 Sean Webster, as the LICENSE file in the GitHub repository states.