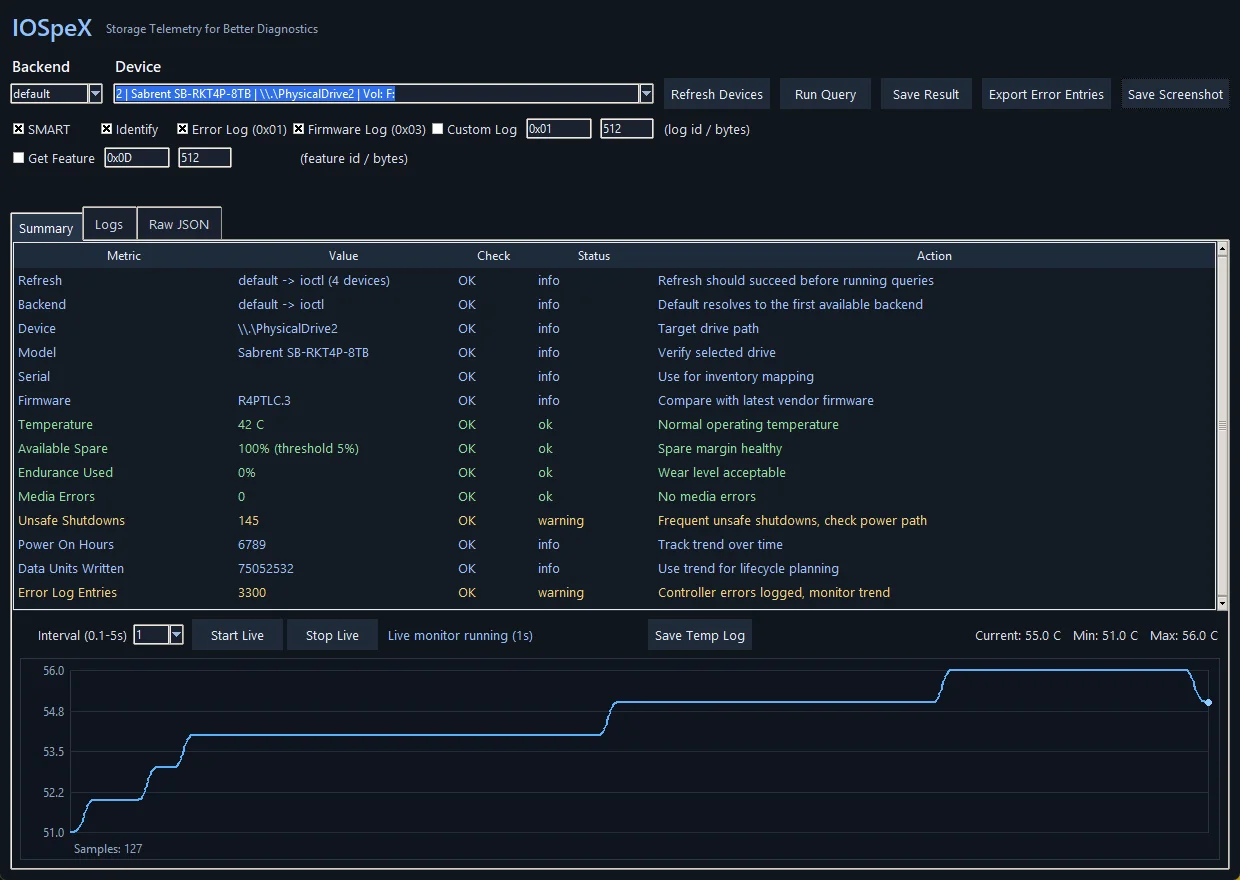
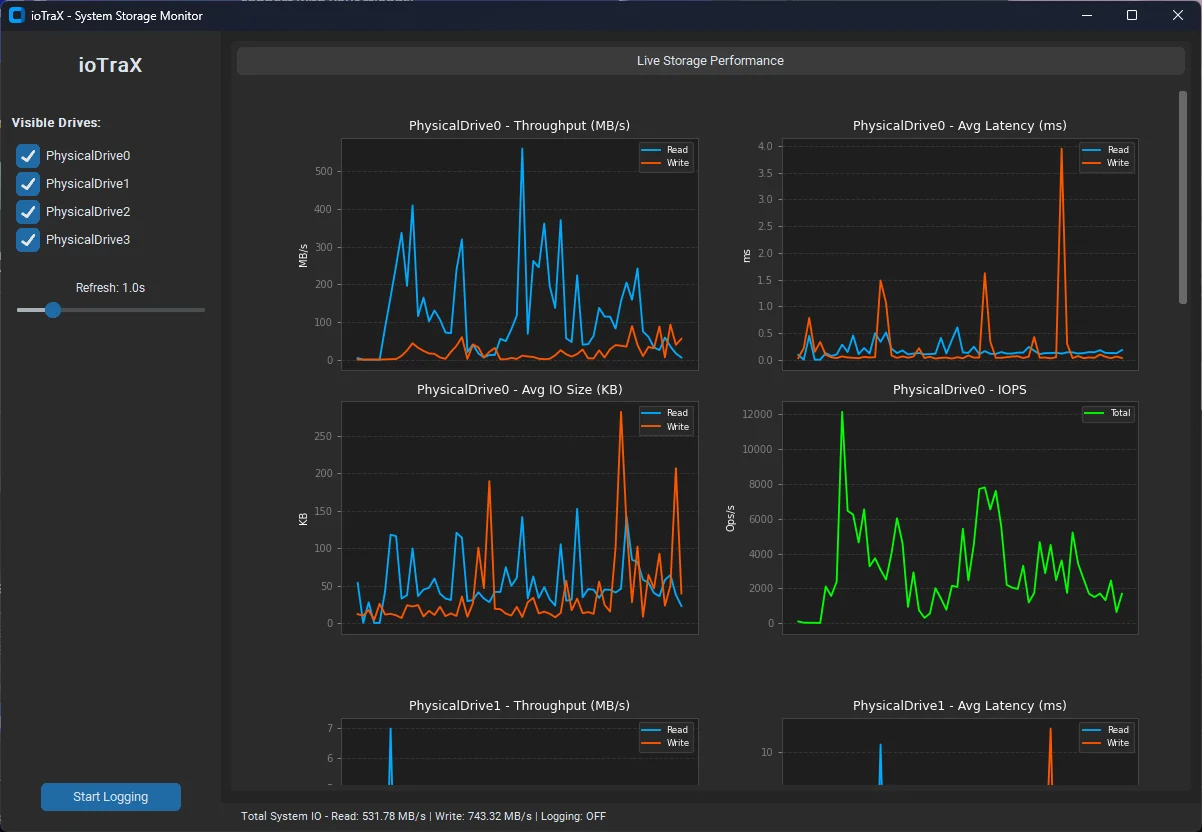
TriageIO is one of the Windows tools on the software page, alongside IOSpeX and ioTraX. IOSpeX reads the NVMe logs of a drive, and ioTraX graphs the live I/O of a machine. TriageIO takes the exports from many drives and lays them side by side. Flash Foundations Part 7 points to its WAF proxy for finding drives that sit above their cohort, and Part 4 points to its anomaly scoring for media error counts. This page covers what TriageIO reads, how it scores a pool, and where those scores stop meaning much.
Introducing TriageIO
Testing a pool of SSDs leaves you with a folder of telemetry exports, and each vendor tool names the same metric differently. At some point you stop asking “how is this drive doing” and start asking “how is the pool doing”, which is the question TriageIO answers.
What it is
TriageIO is a Windows desktop application that reads vendor-specific .xlsx telemetry exports, maps their field names onto one canonical schema, classifies every drive as OK, WARNING or ERROR, and shows the whole pool across six analysis tabs. It is built with Python, Tkinter and matplotlib.
With a pool of drives in different states of health, the first task is sorting out what is critical, what is trending toward failure, and what is fine. TriageIO gives you that picture and lets you drill down to the data behind it.
The problem it solves
Every vendor tool exports SMART data slightly differently. Temperature might be Composite Temperature, Temperature Sensor 1 or Airflow Temperature Cel. Available spare might be Spare Available or Spare Block Remaining. Before you can compare drives from different sources, you have to reconcile the names, and that eats time before you have looked at a single data point.
TriageIO does the reconciliation with a built-in alias table. Point it at a folder of exports and press Refresh Master Analysis, and you get one unified pool instead of a spreadsheet stitching job.
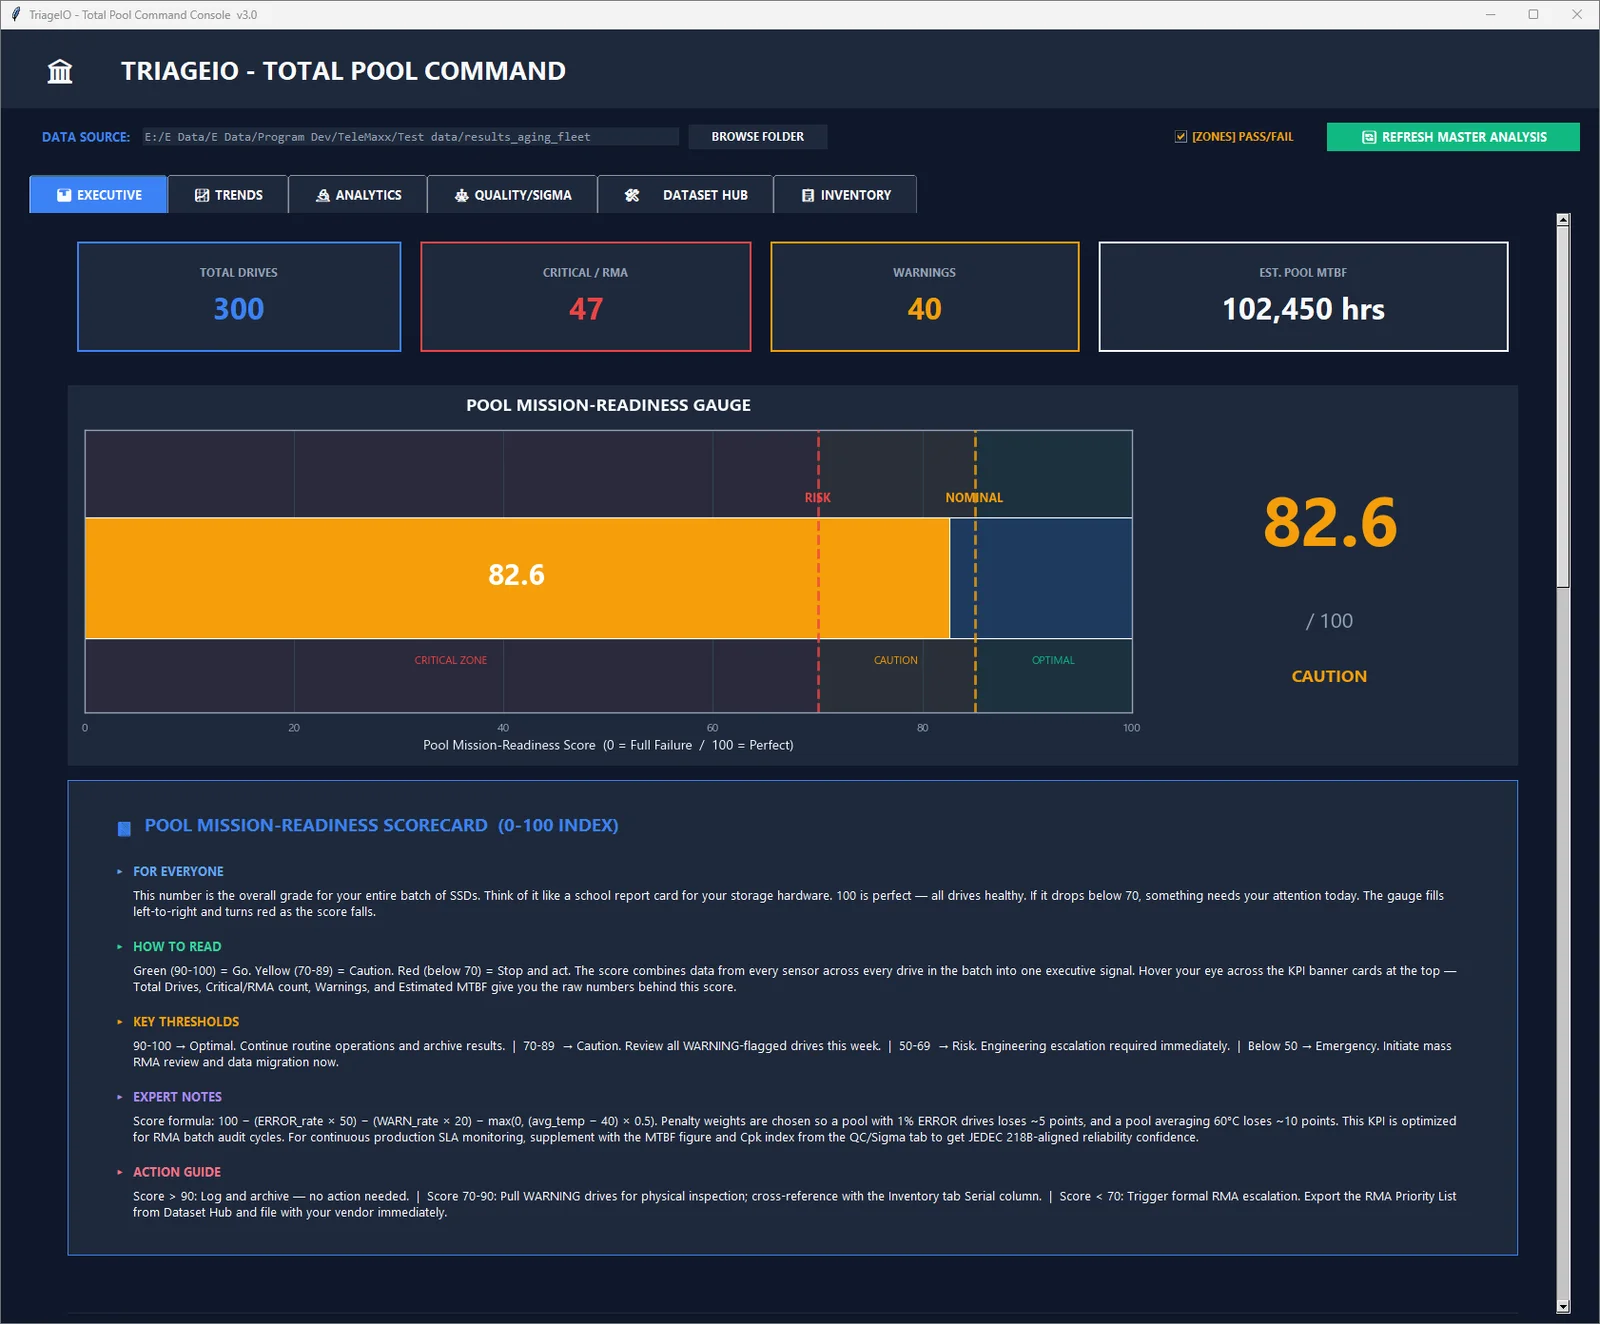
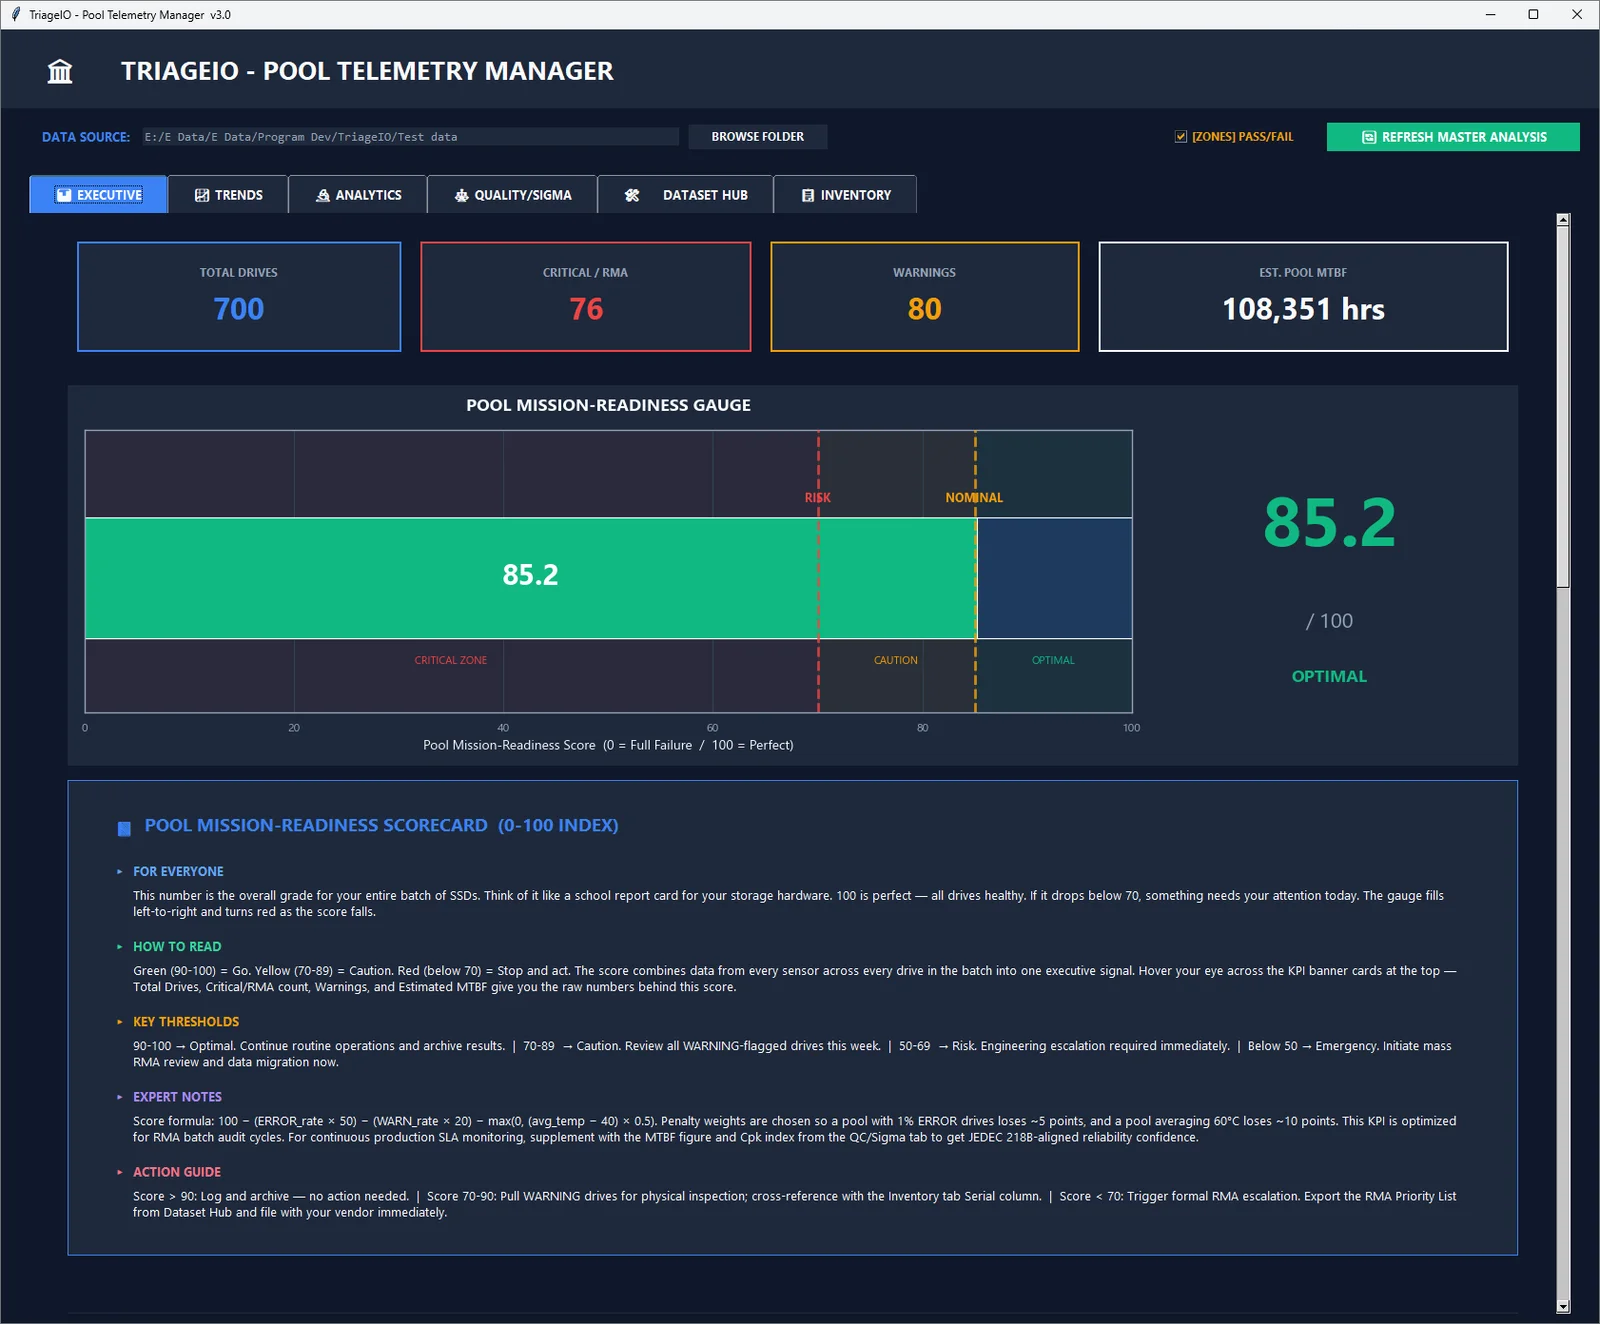
The second problem is spotting the bad drives among many. One drive with a warning is easy to triage by hand, and dozens across a pool are not. A Pool Mission-Readiness Gauge collapses the pool into a single 0 to 100 score with shaded zones, so you can see at a glance whether the batch looks routine or needs a closer look. The score is a fixed-weight heuristic, built as described under Fleet score.
Six tabs, one picture
Six analysis tabs organize the UI, each serving a different layer of the reliability picture.
Interface walkthrough
Executive
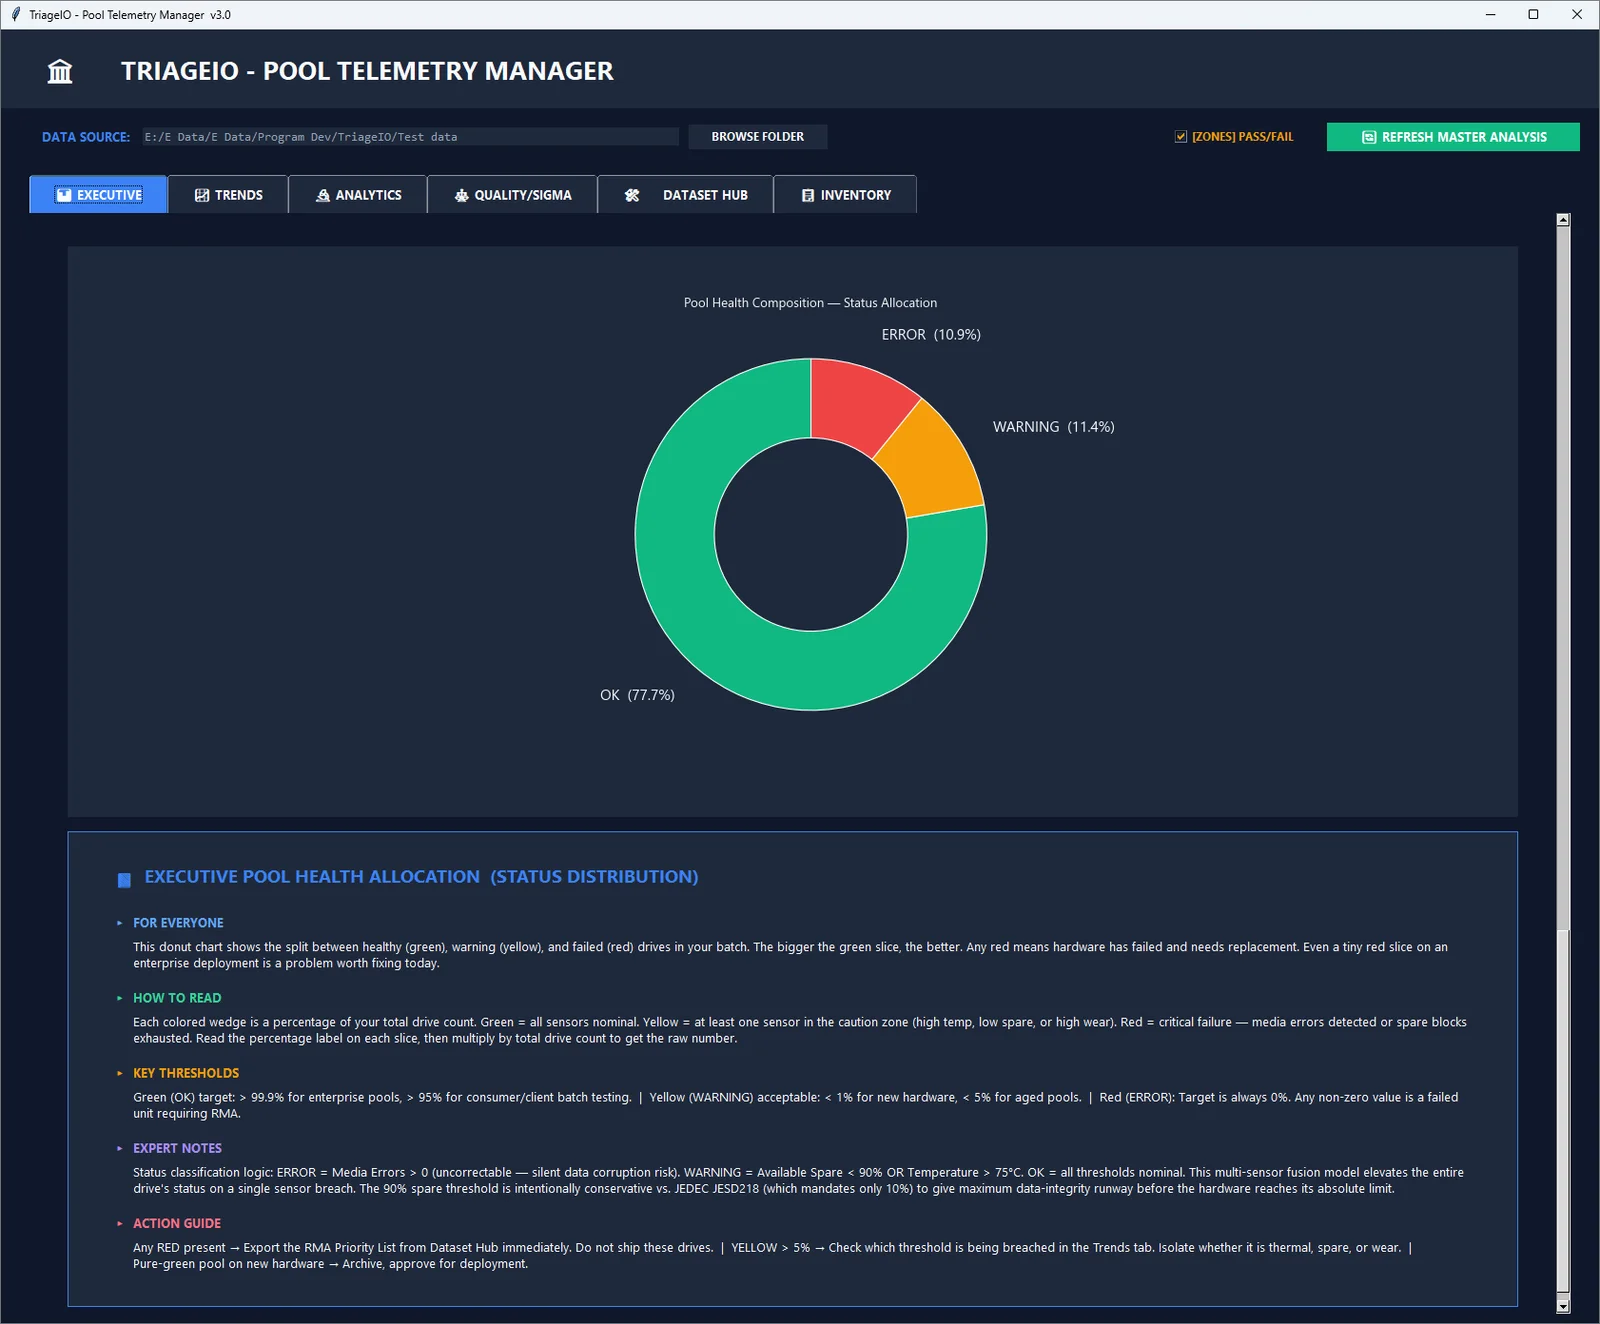
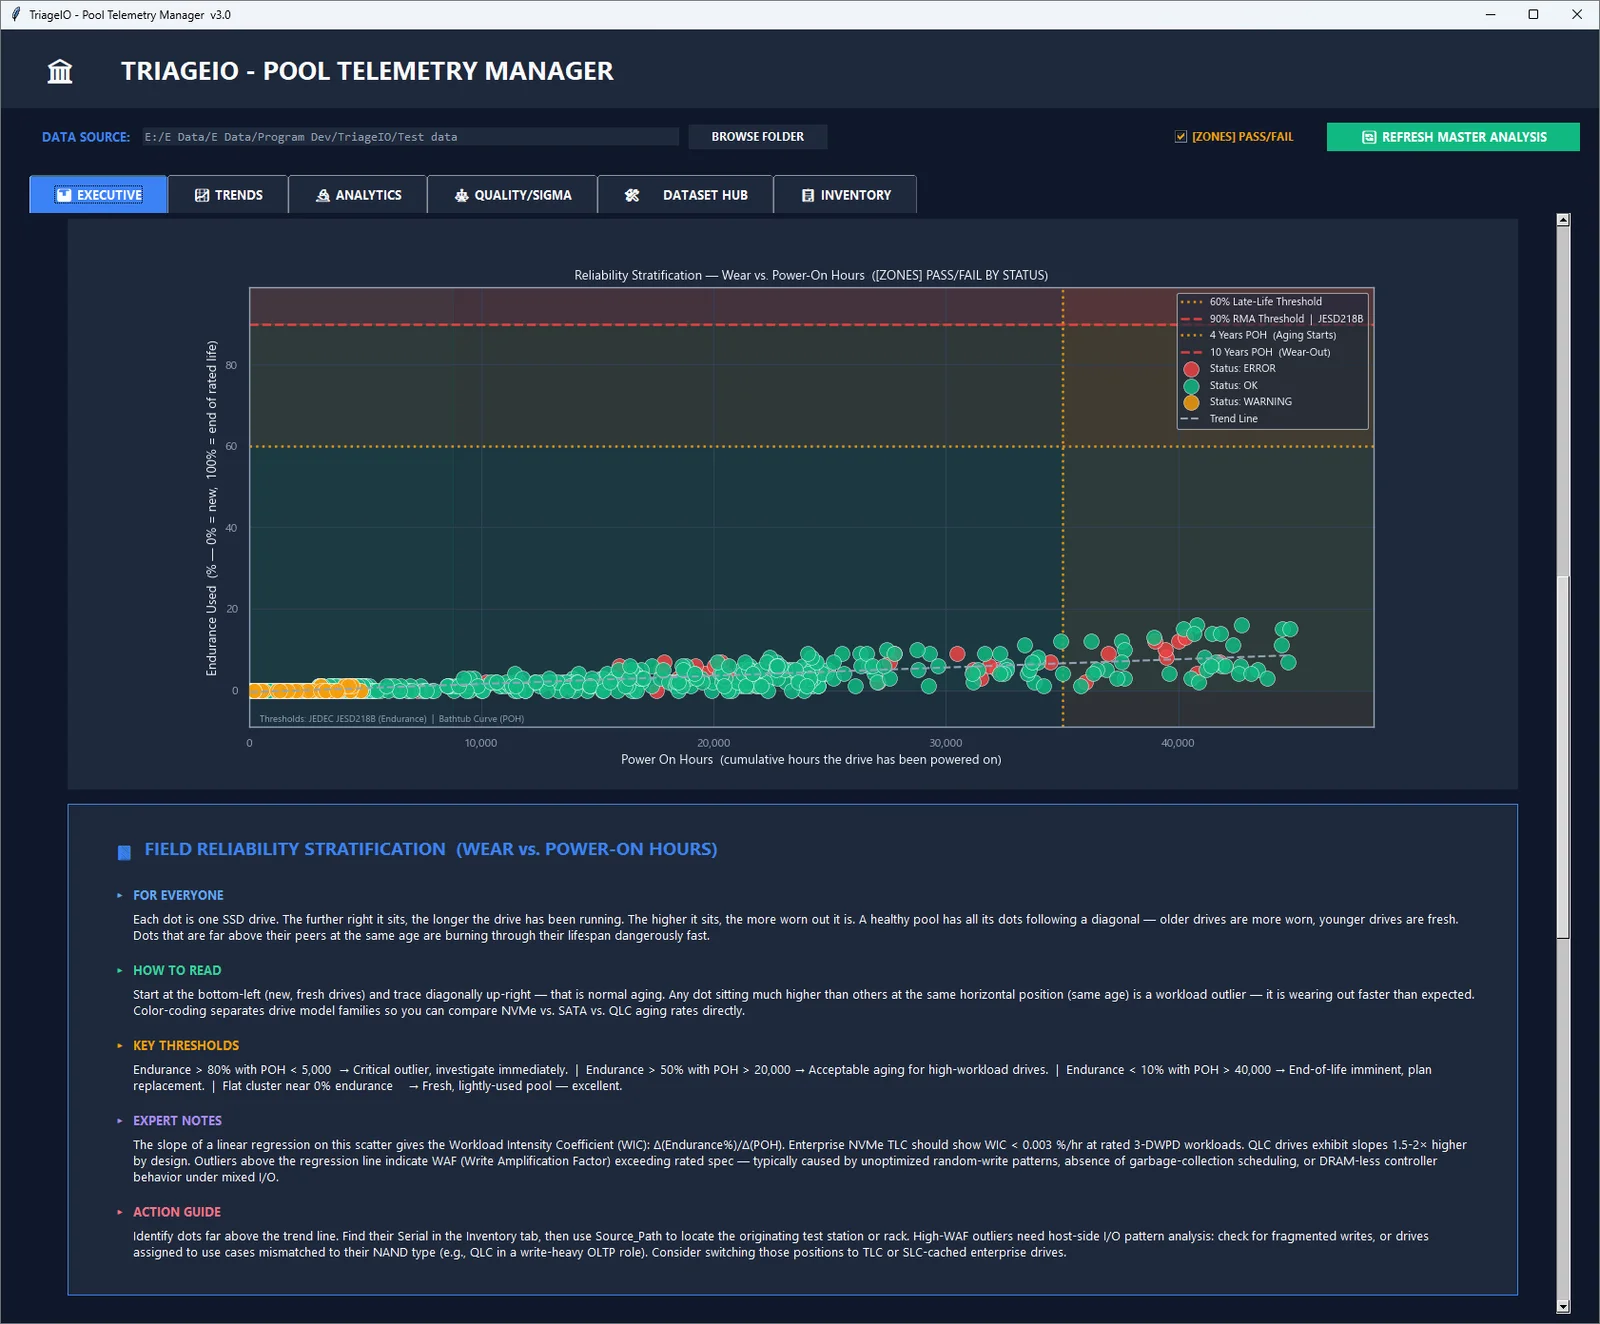
Fleet-level command view. KPI banner (total drives, Critical/RMA count, warnings, estimated pool MTBF), Pool Mission-Readiness Gauge, reliability scatter (Power On Hours versus Endurance Used with regression line), and health donut. Every chart comes with a five-section insight panel covering plain-language interpretation, key thresholds, expert notes, and action guidance.
Trends
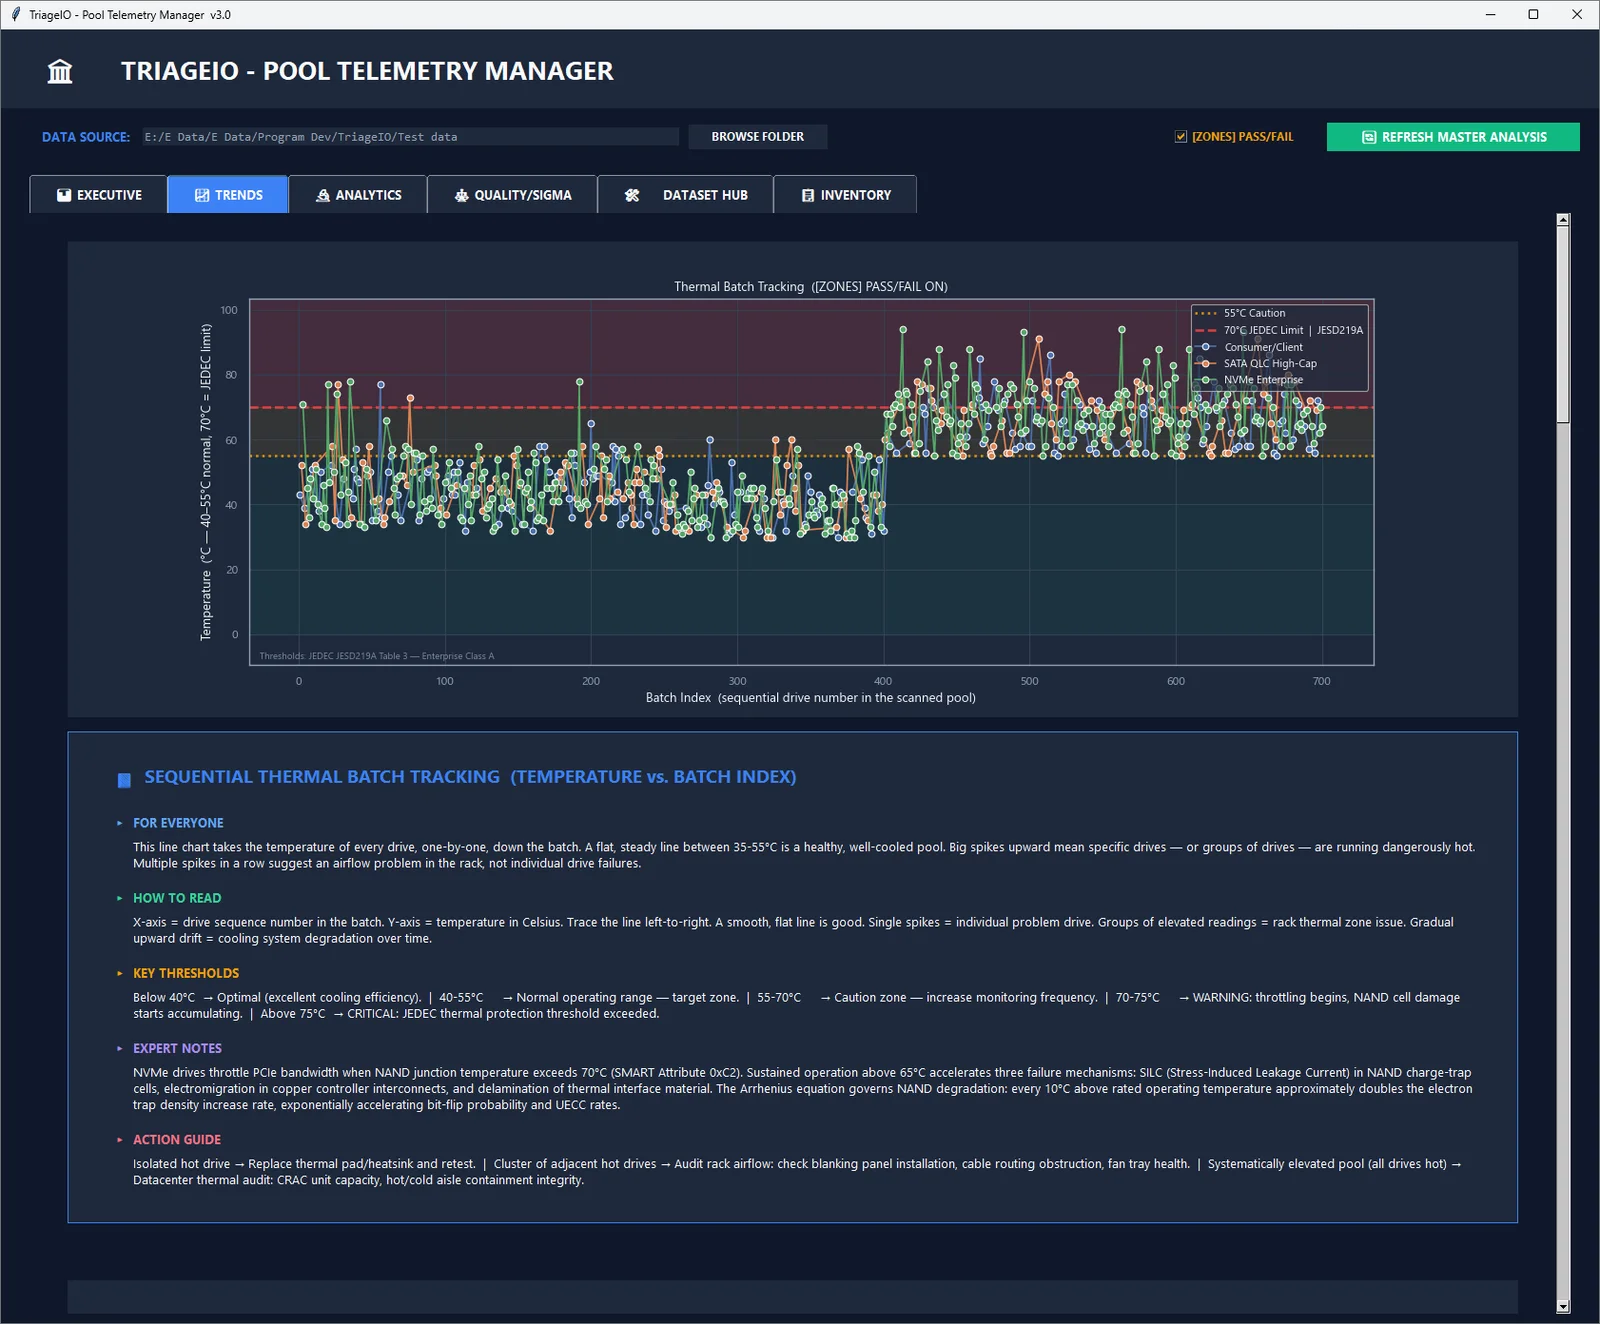
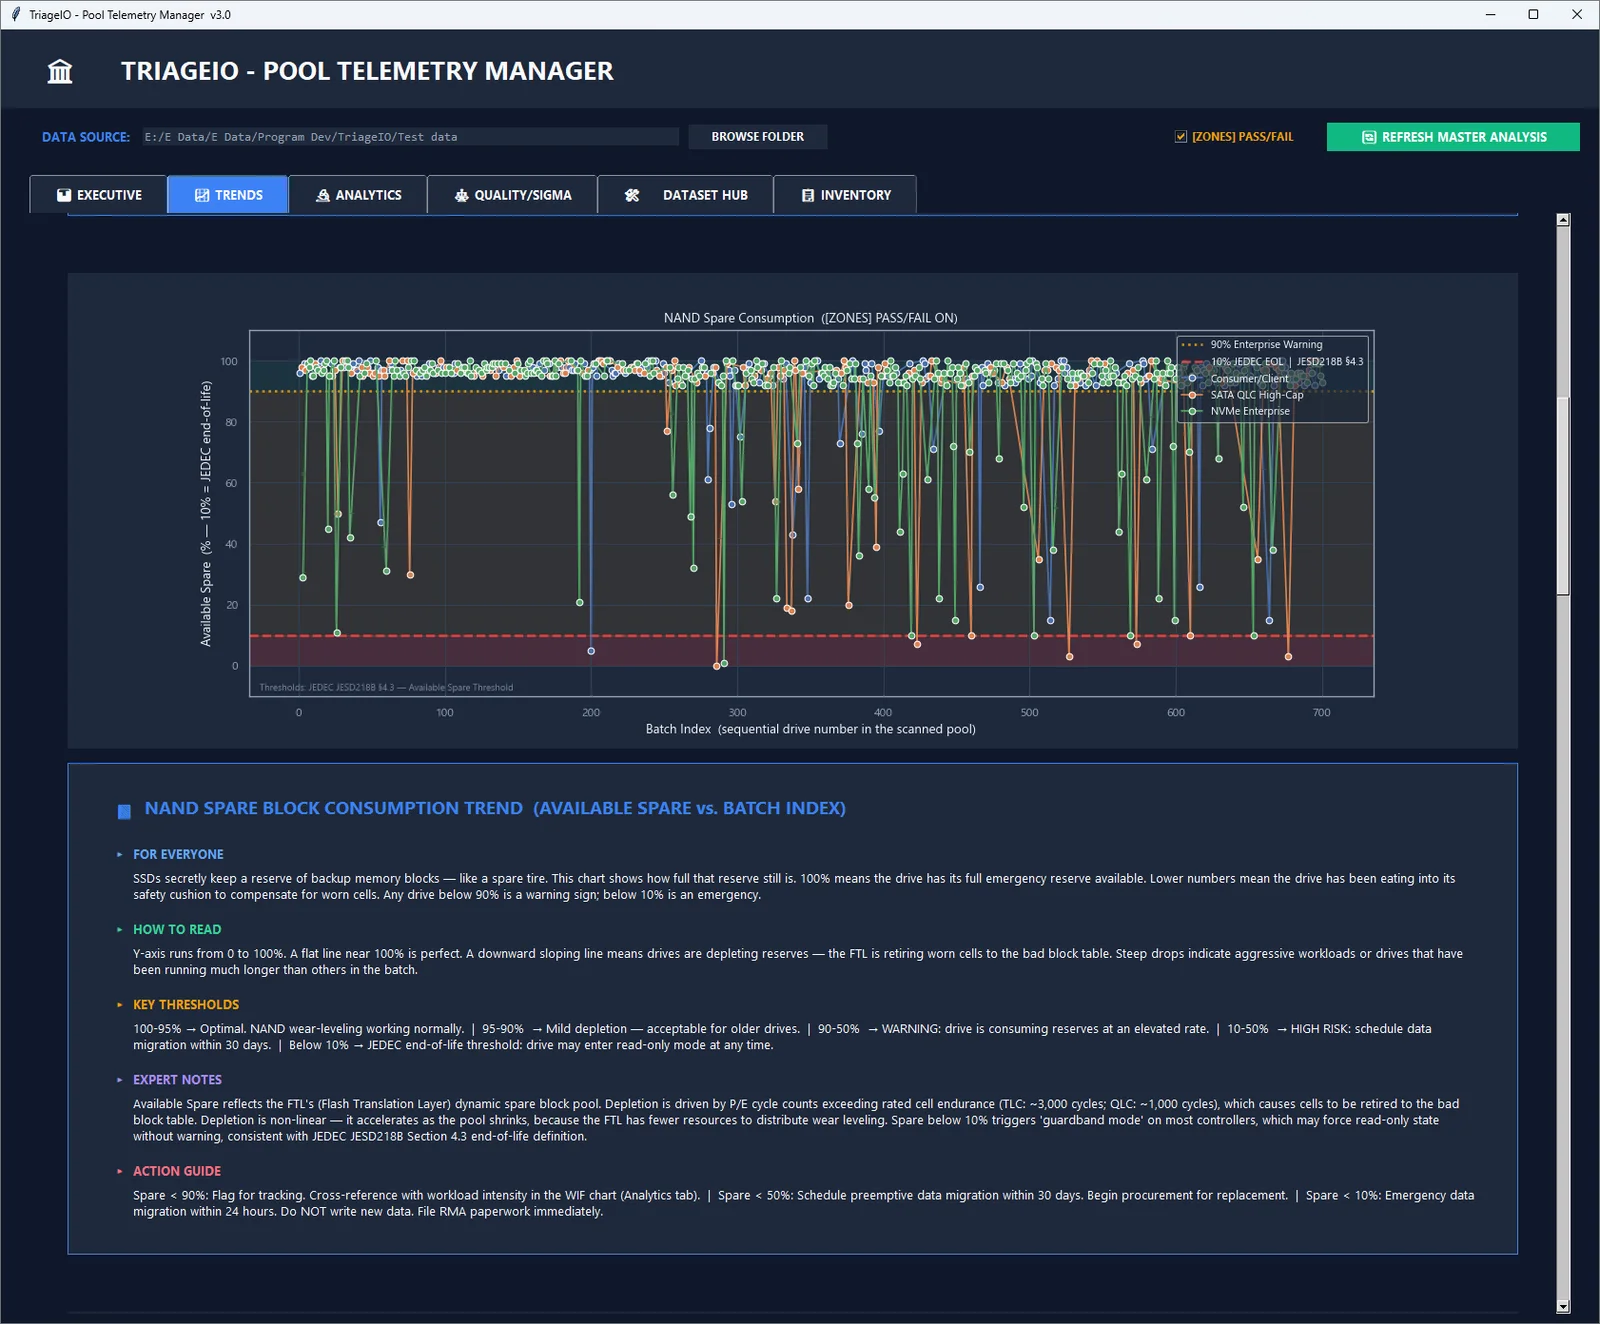
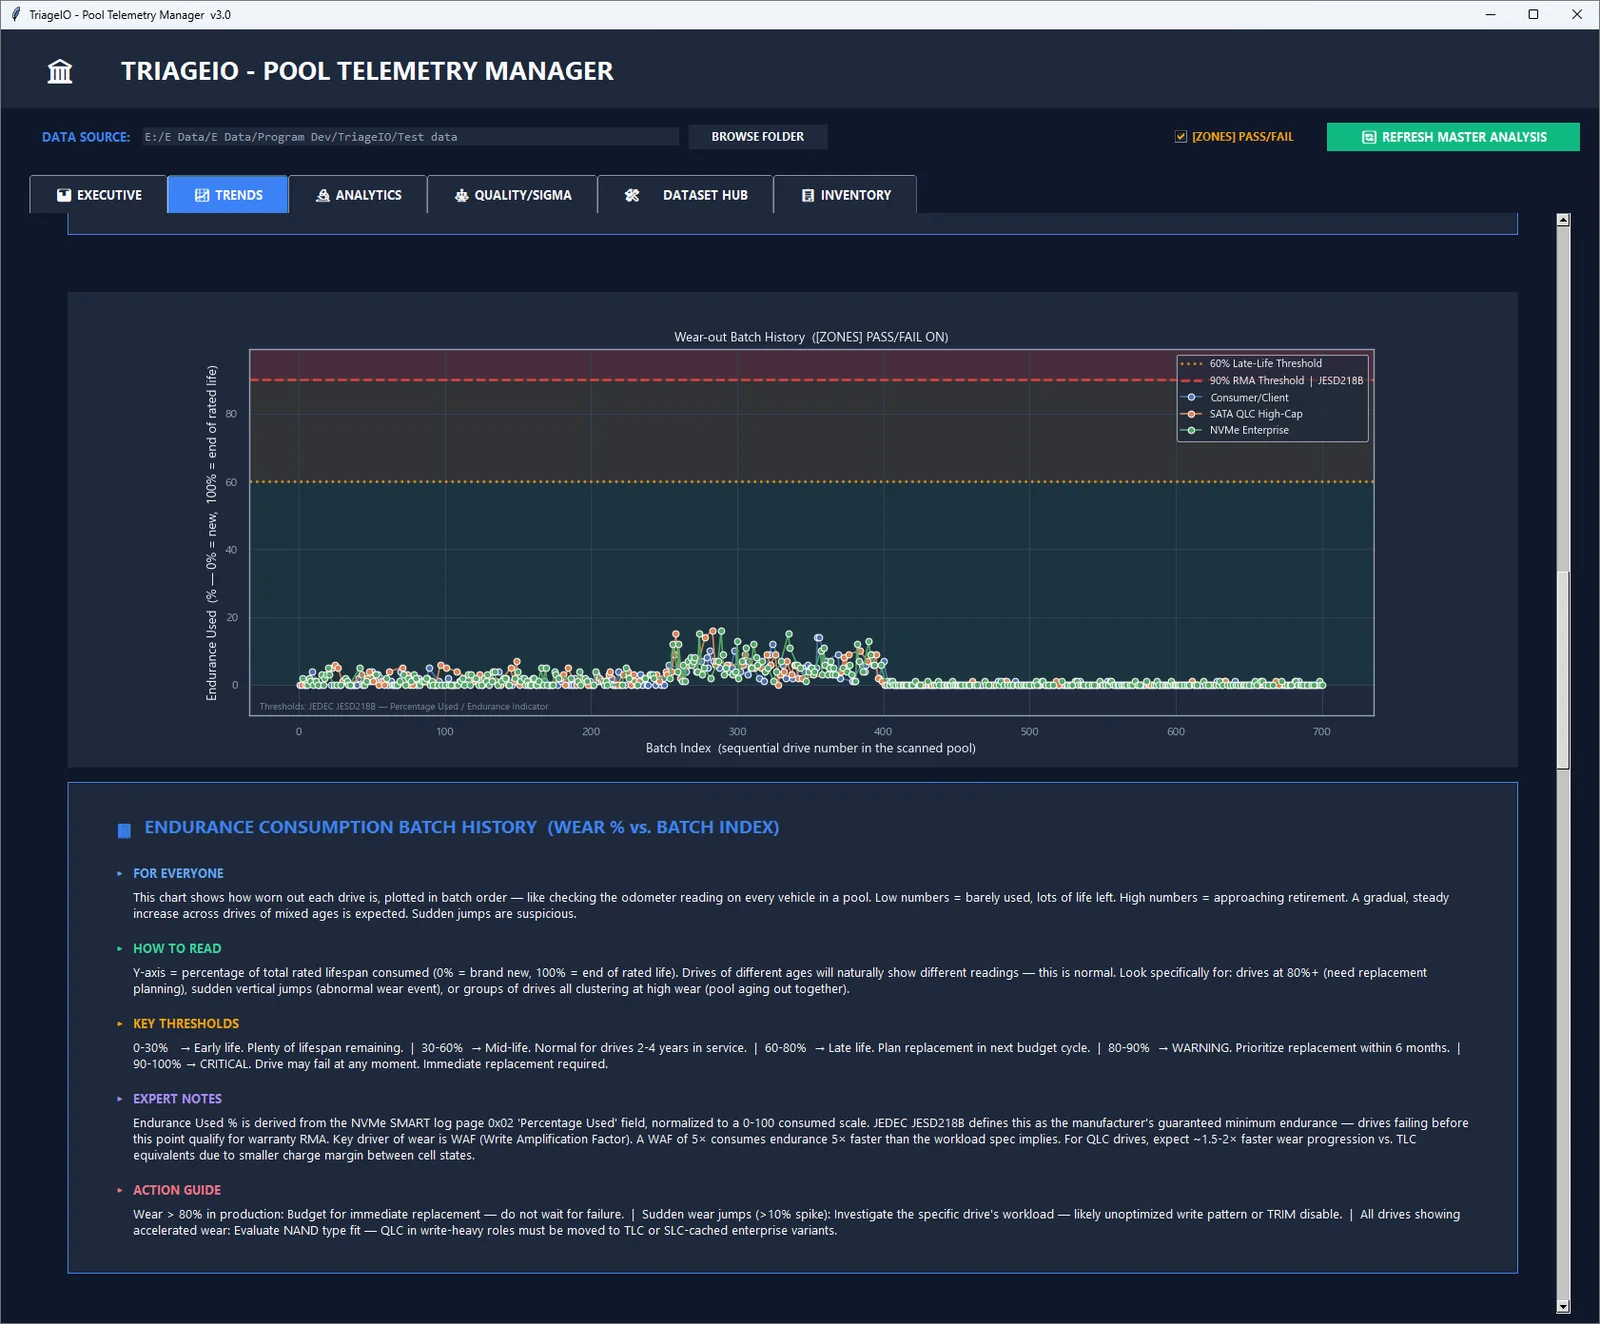
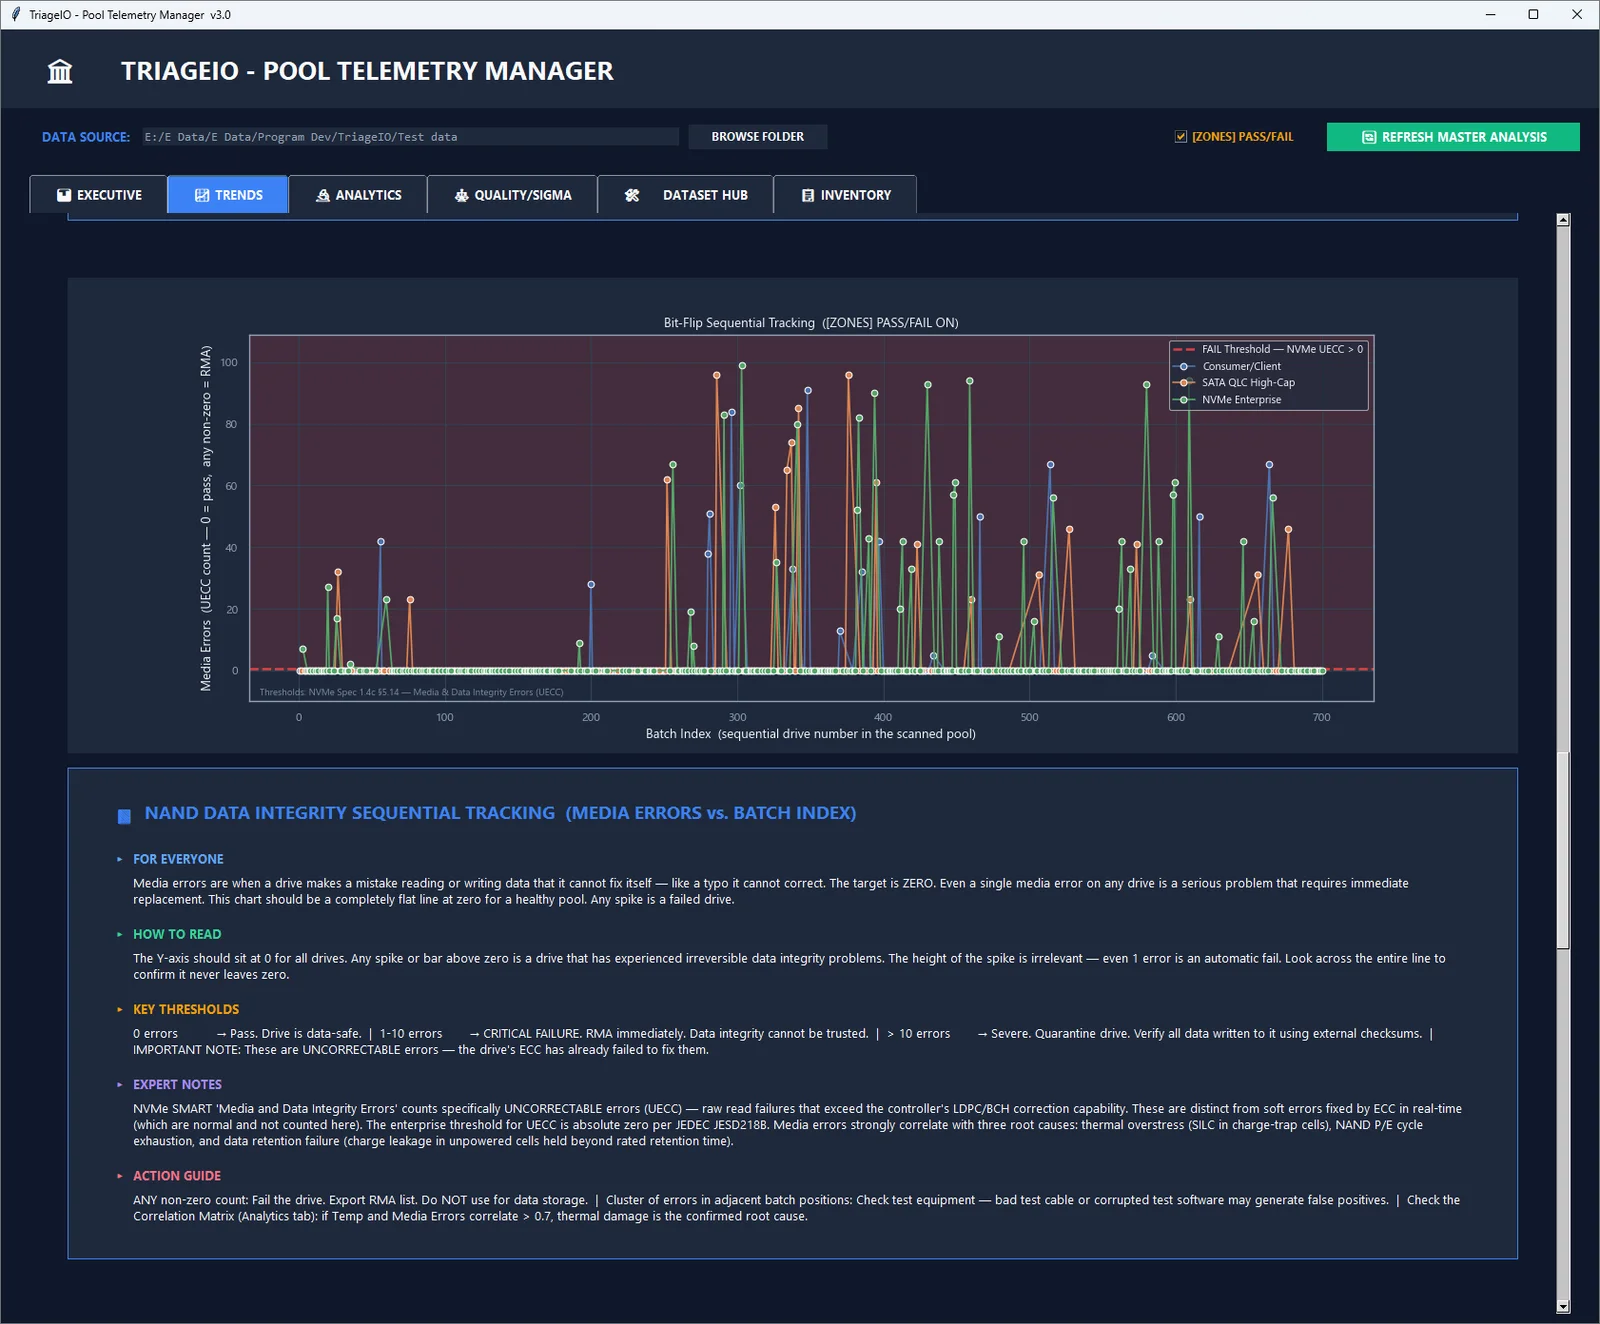
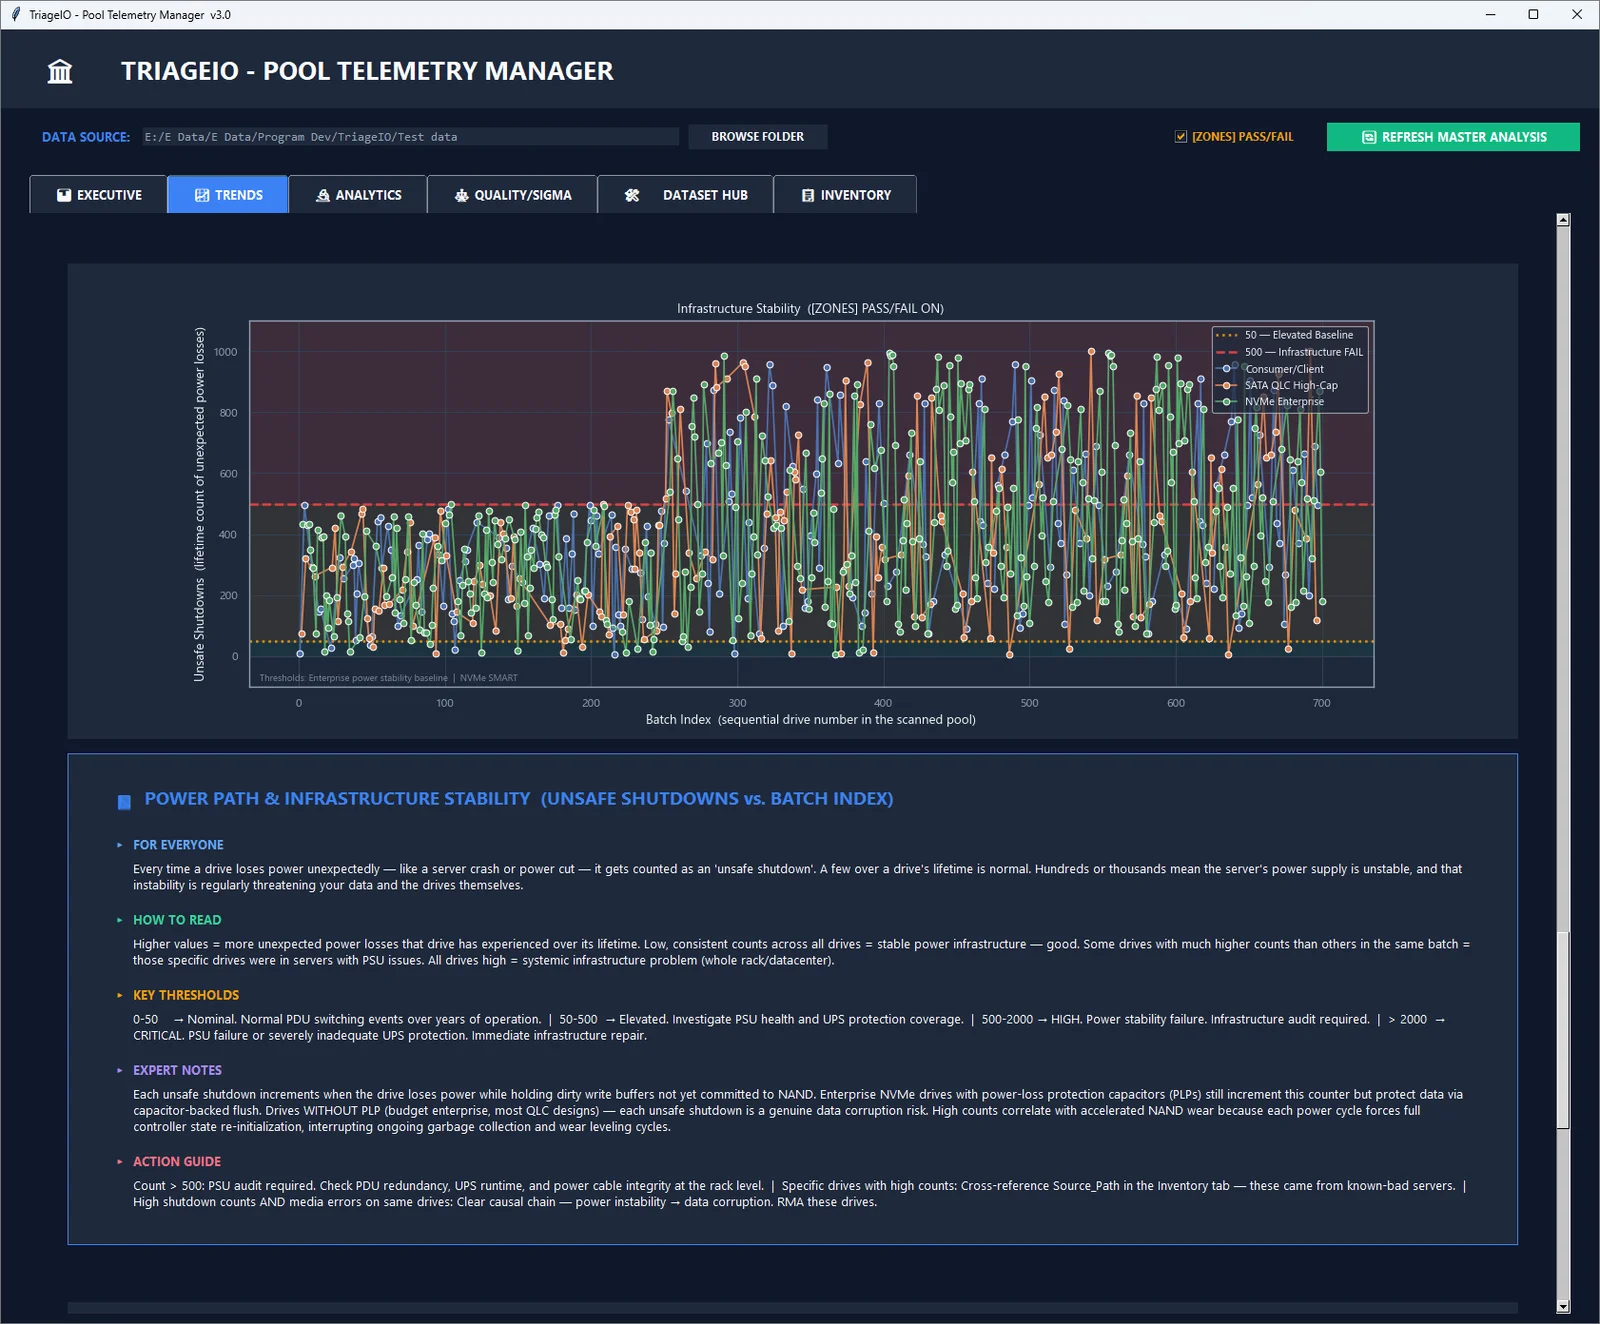
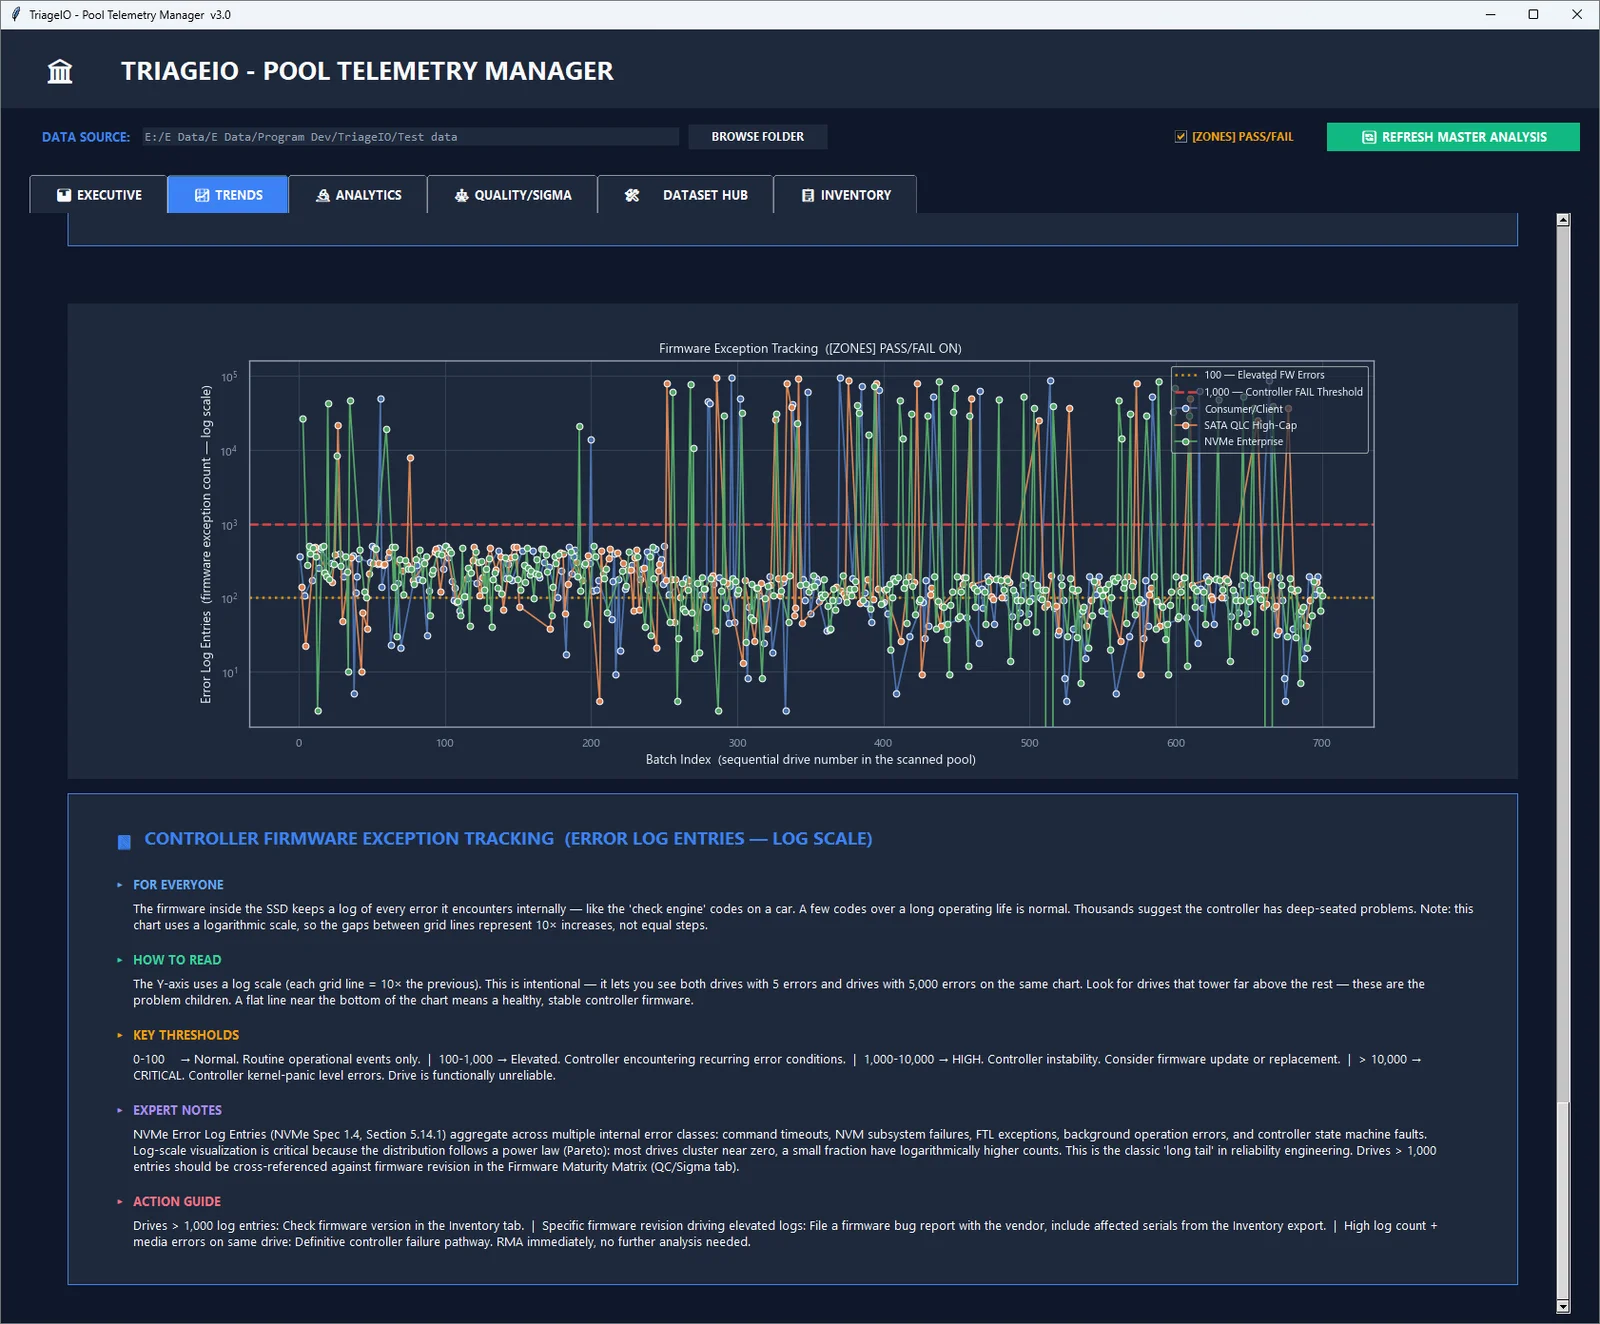
Line charts across the files in a batch, in file order, for temperature, available spare, endurance used, media errors, unsafe shutdowns, and error log entries. Error log entries render on a log scale to handle the range variance typical in mixed-health pools.
Analytics
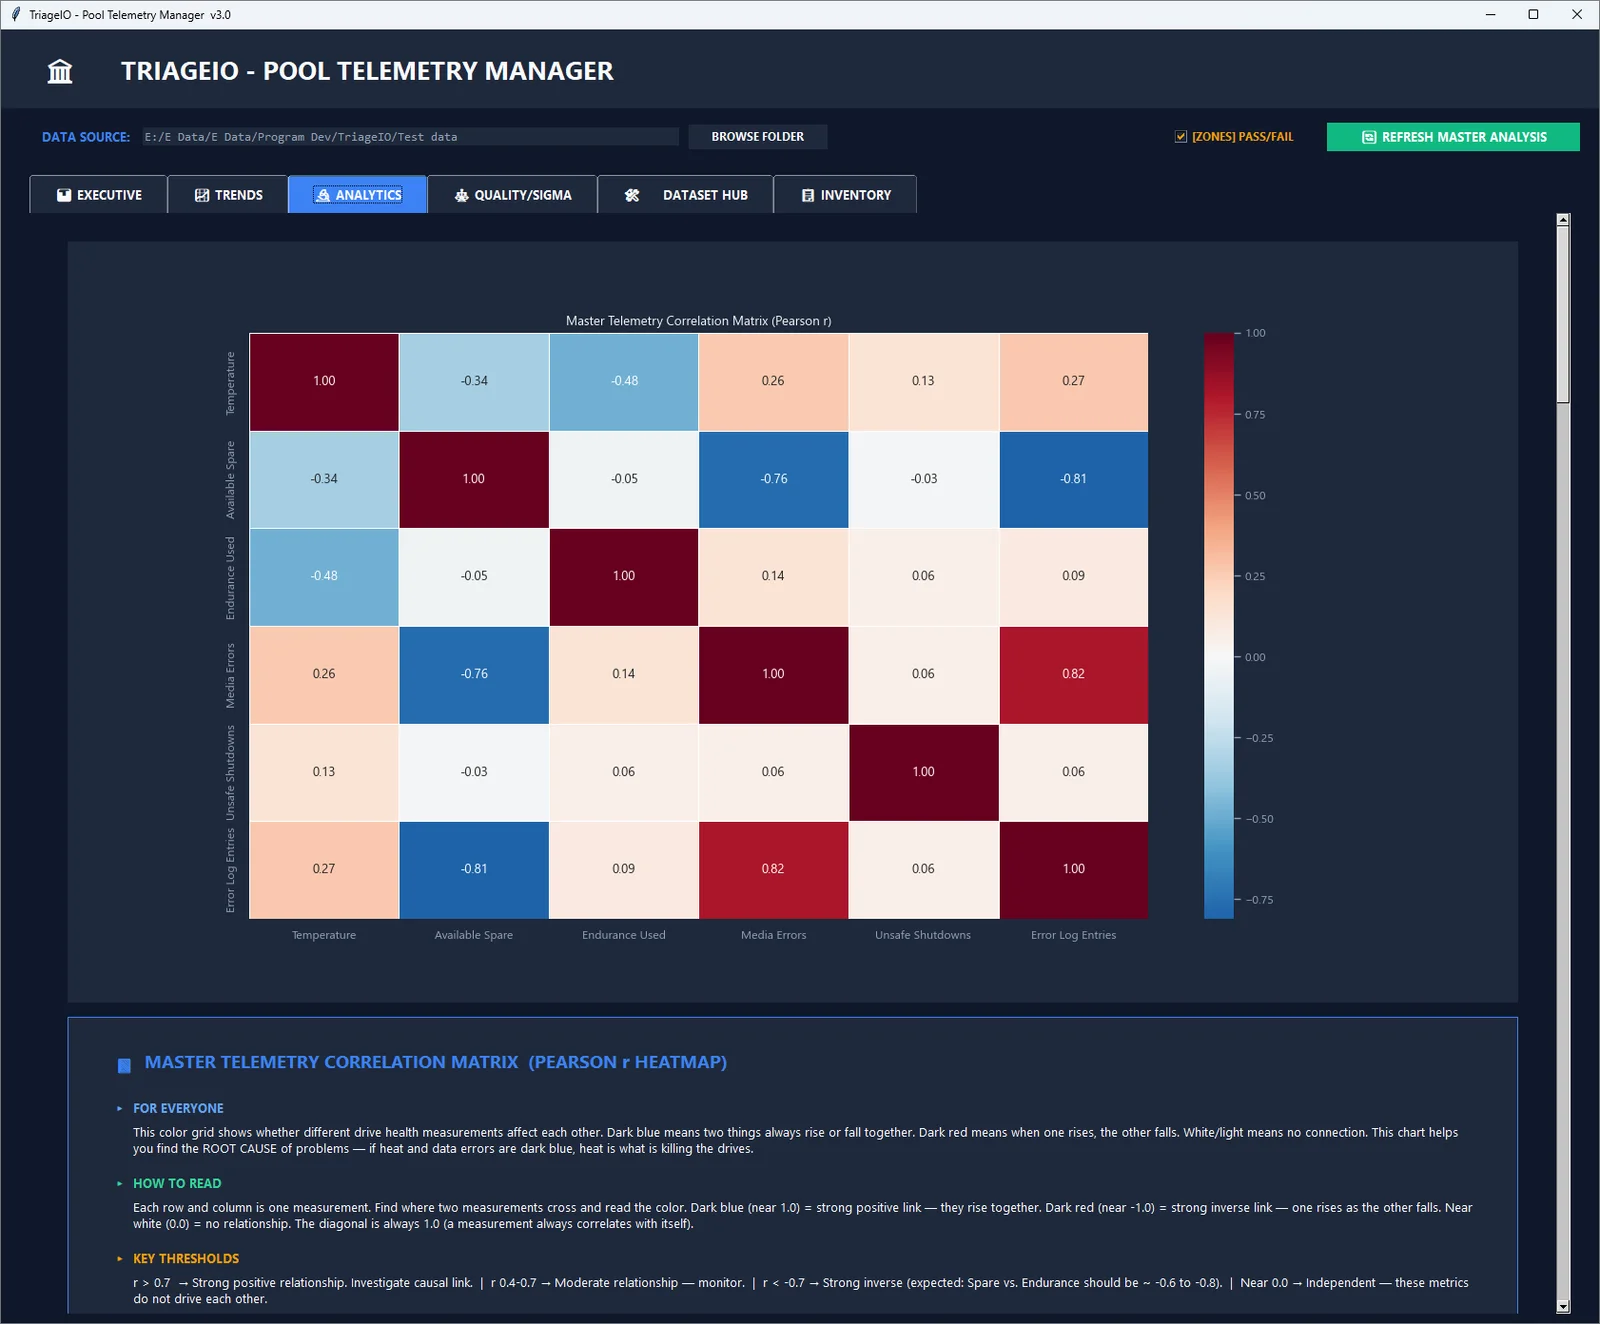
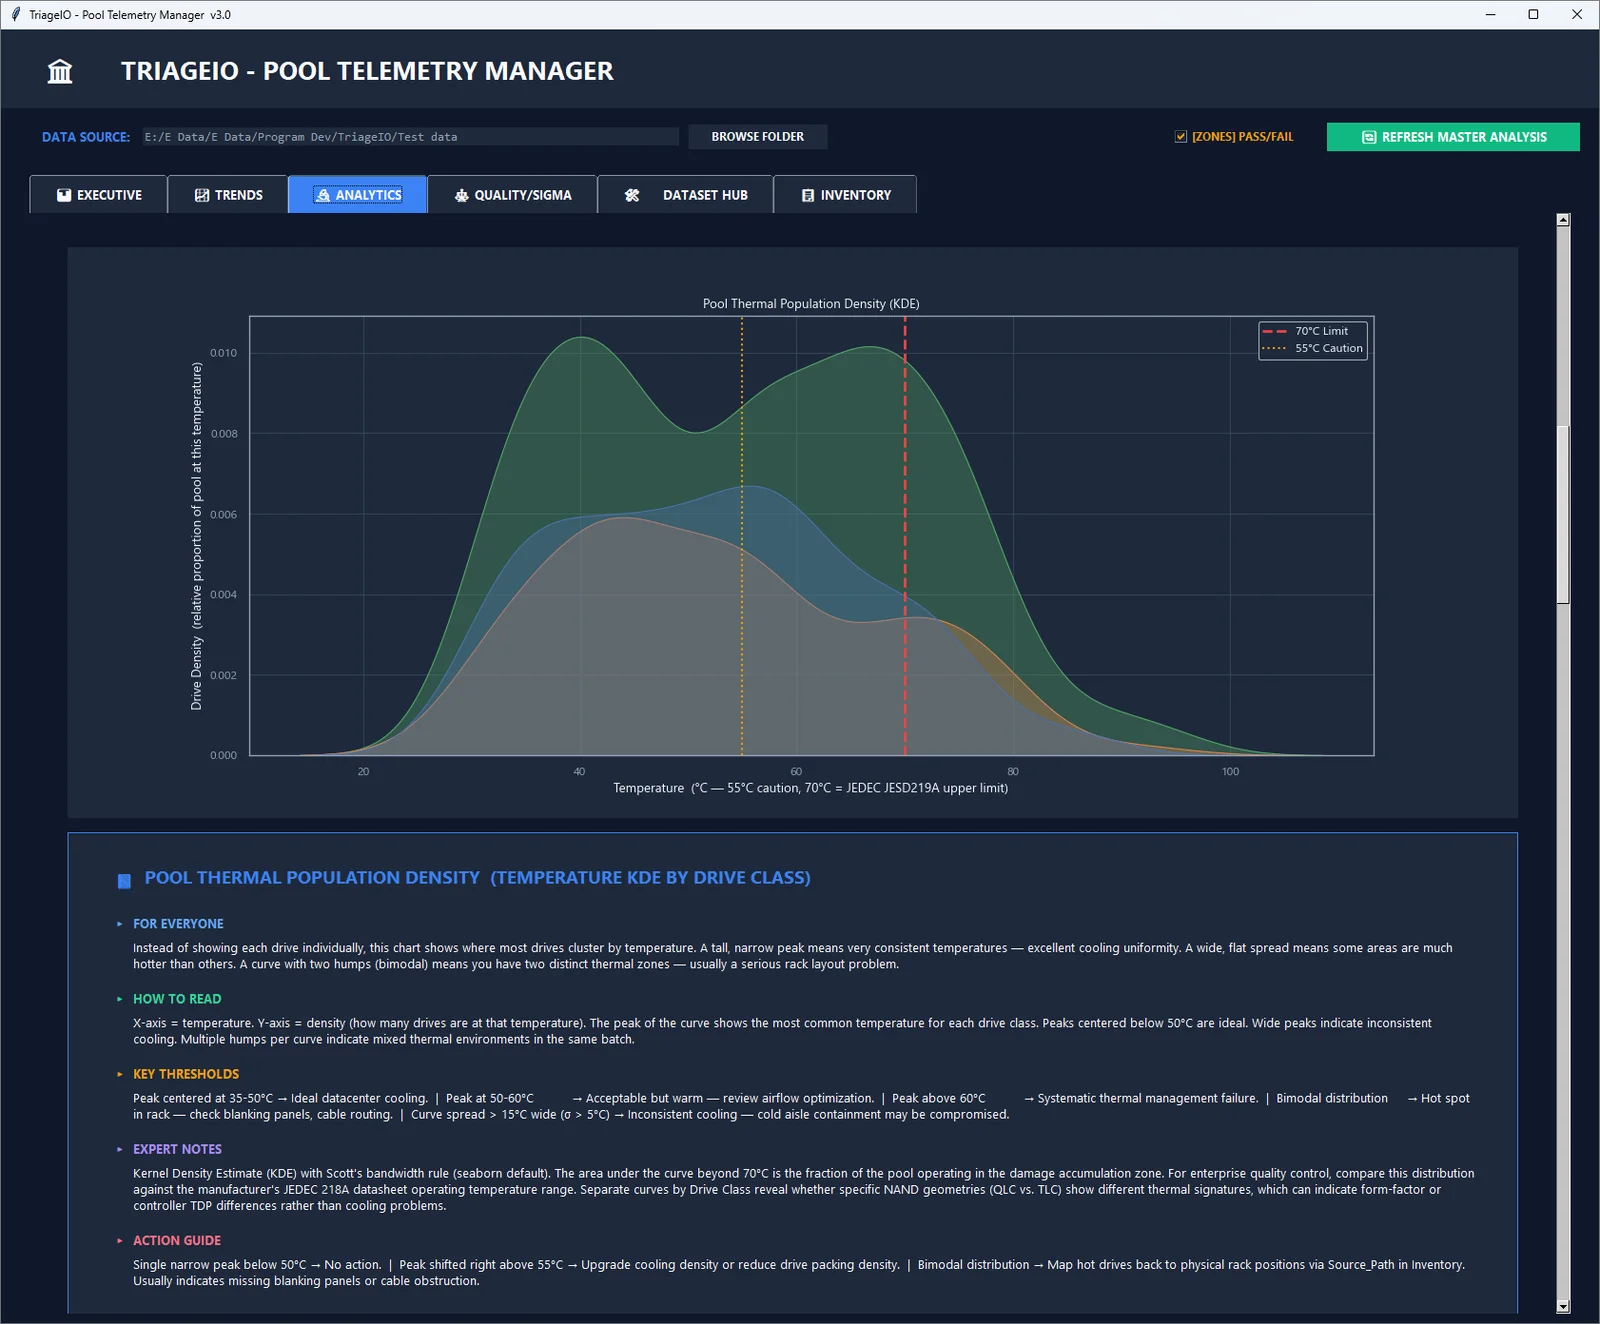
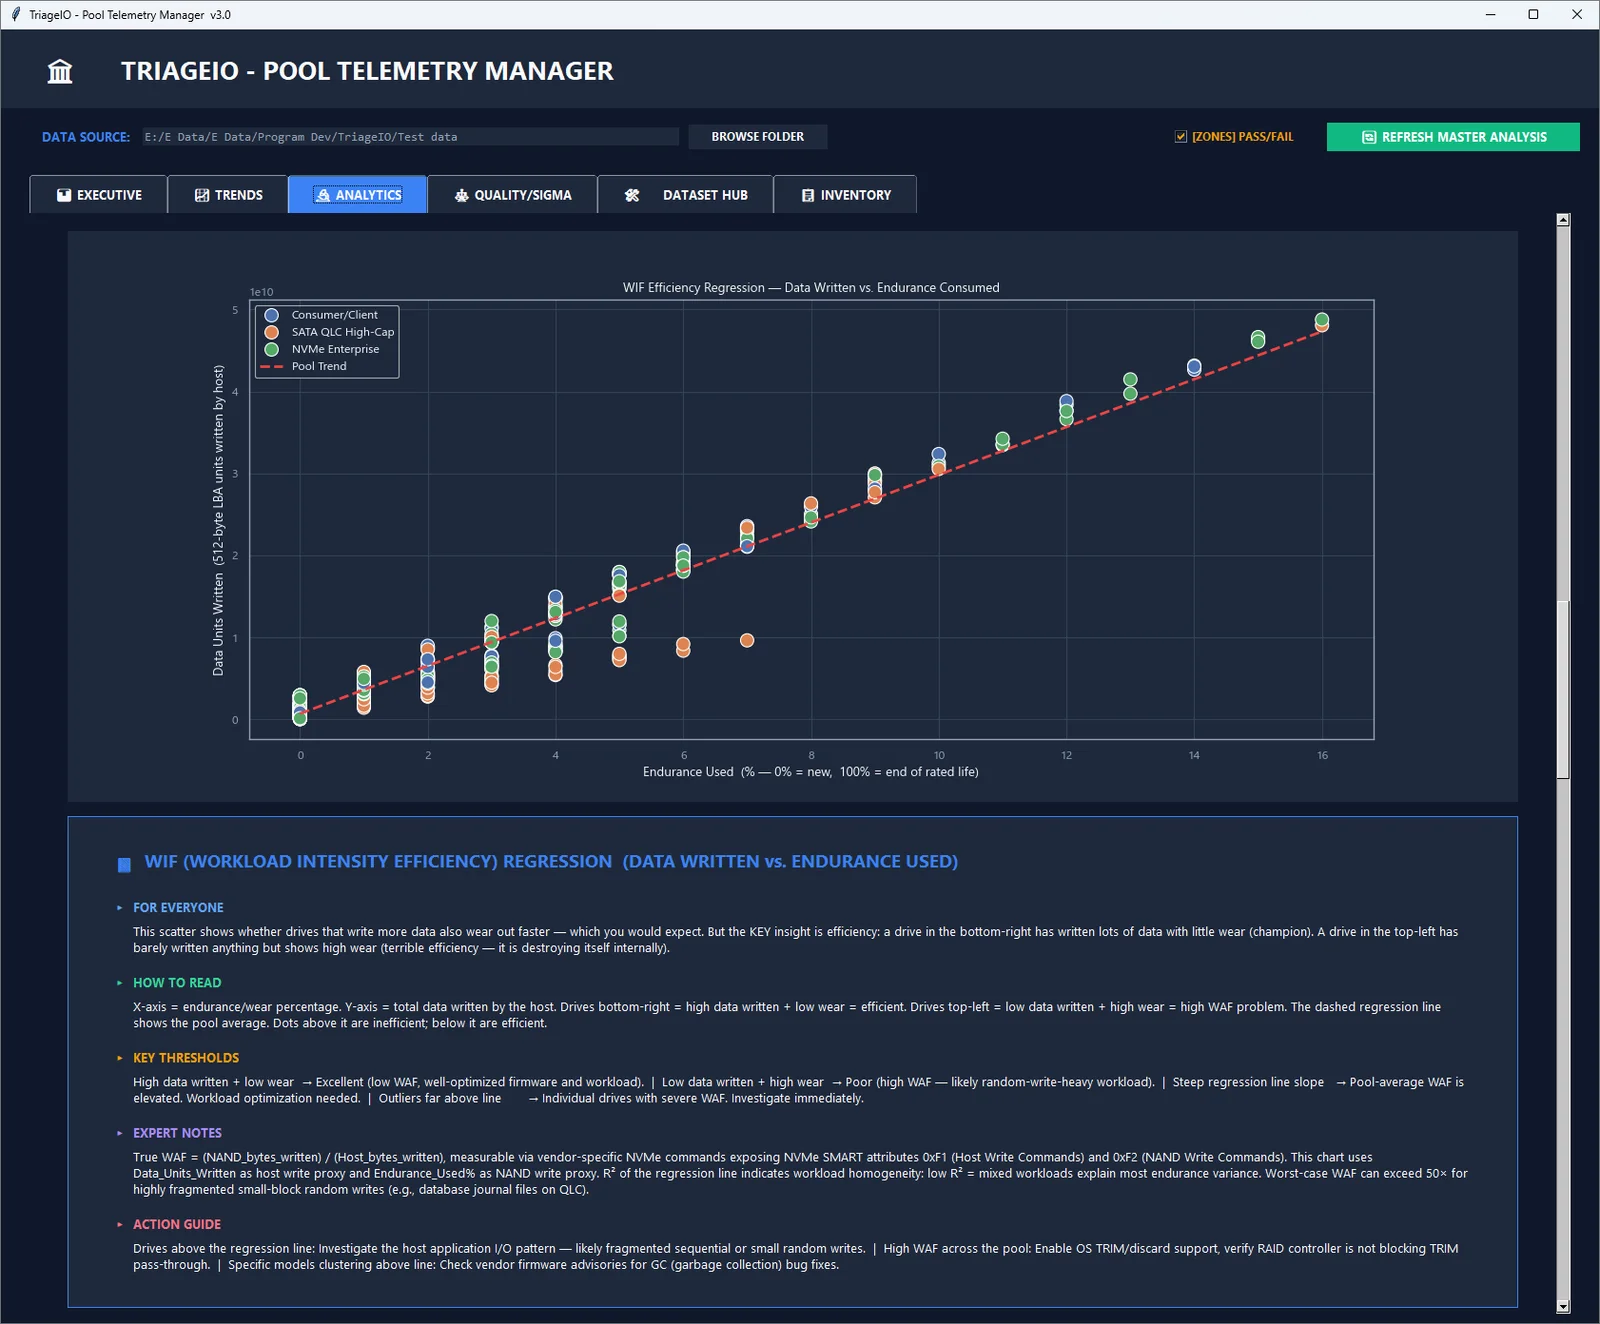
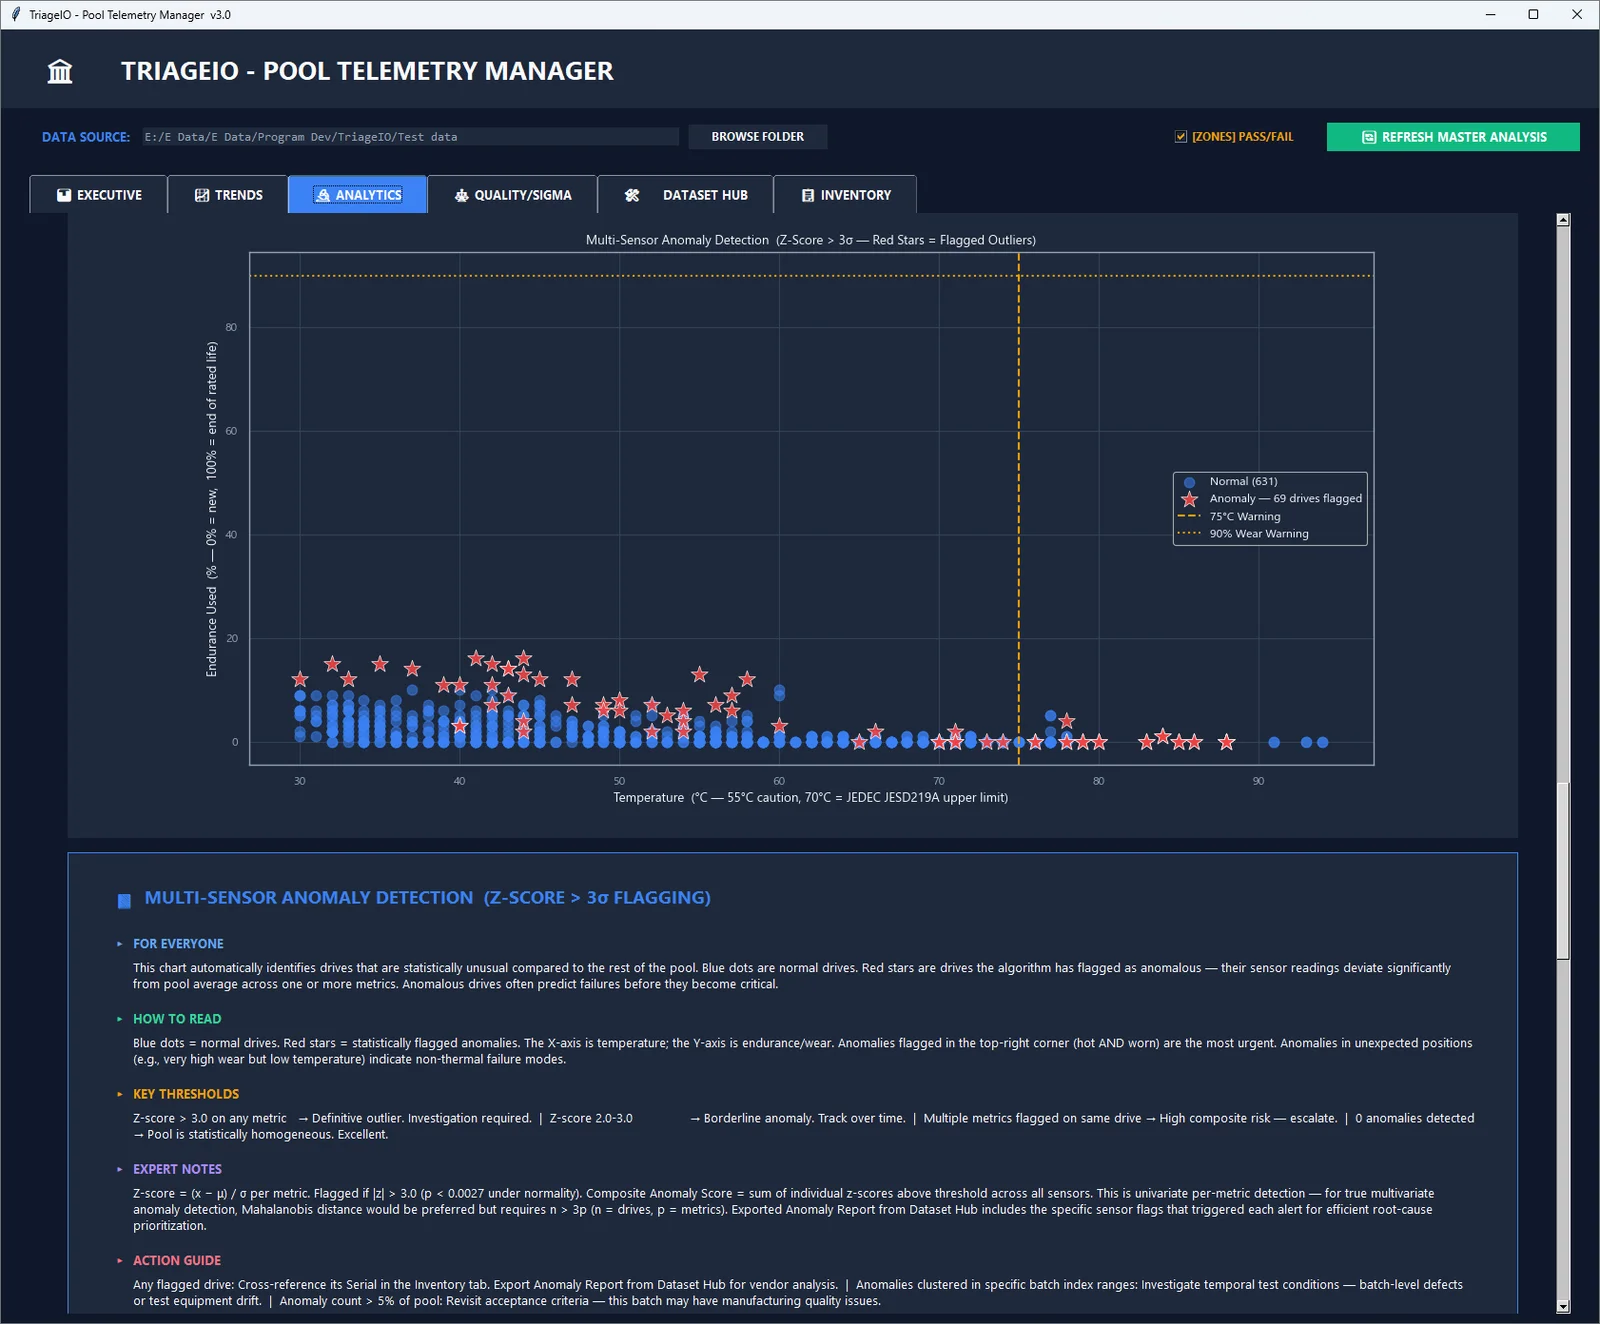
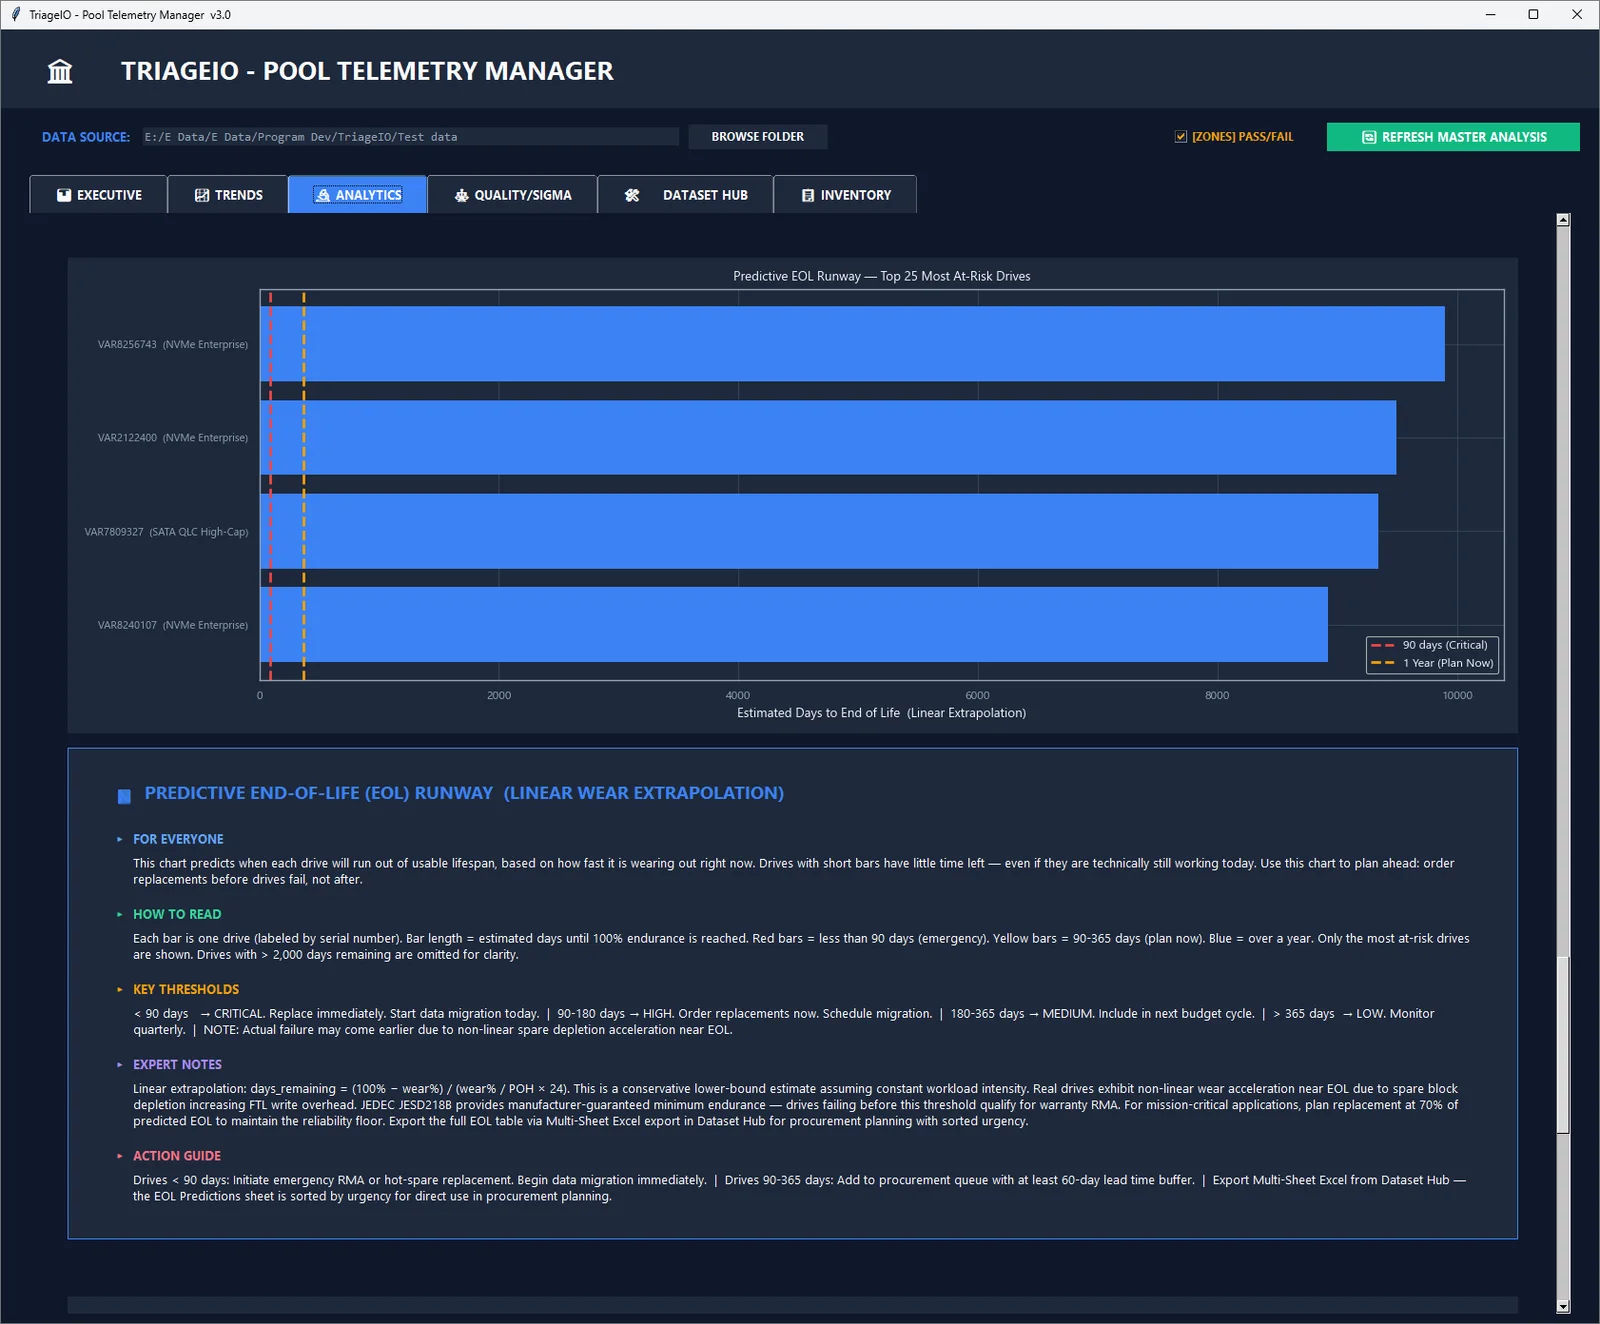
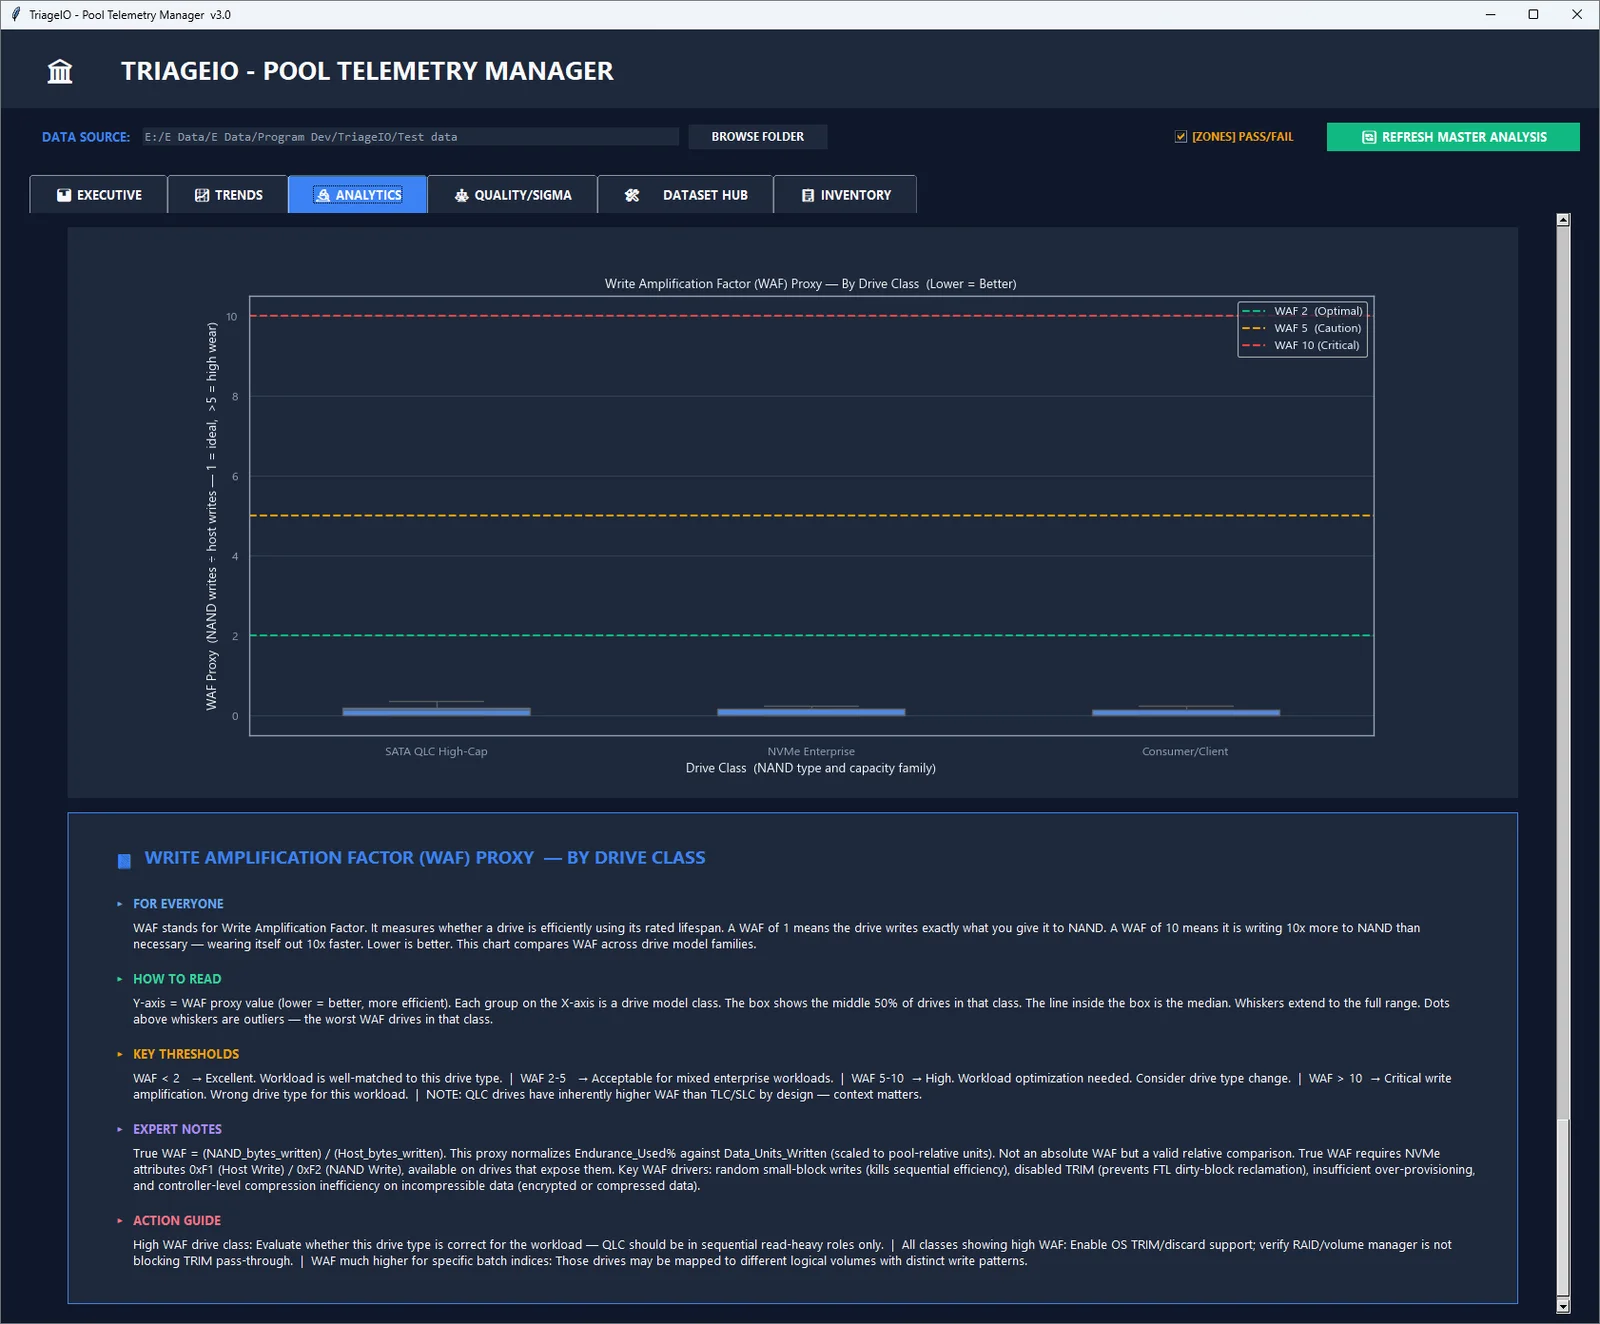
Pearson correlation heatmap, thermal KDE density by drive class, endurance versus written regression, multi-sensor anomaly scatter with flagged drives marked, predictive EOL bar chart for the top 25 at-risk drives, and WAF proxy boxplot by drive class.
Quality / Sigma
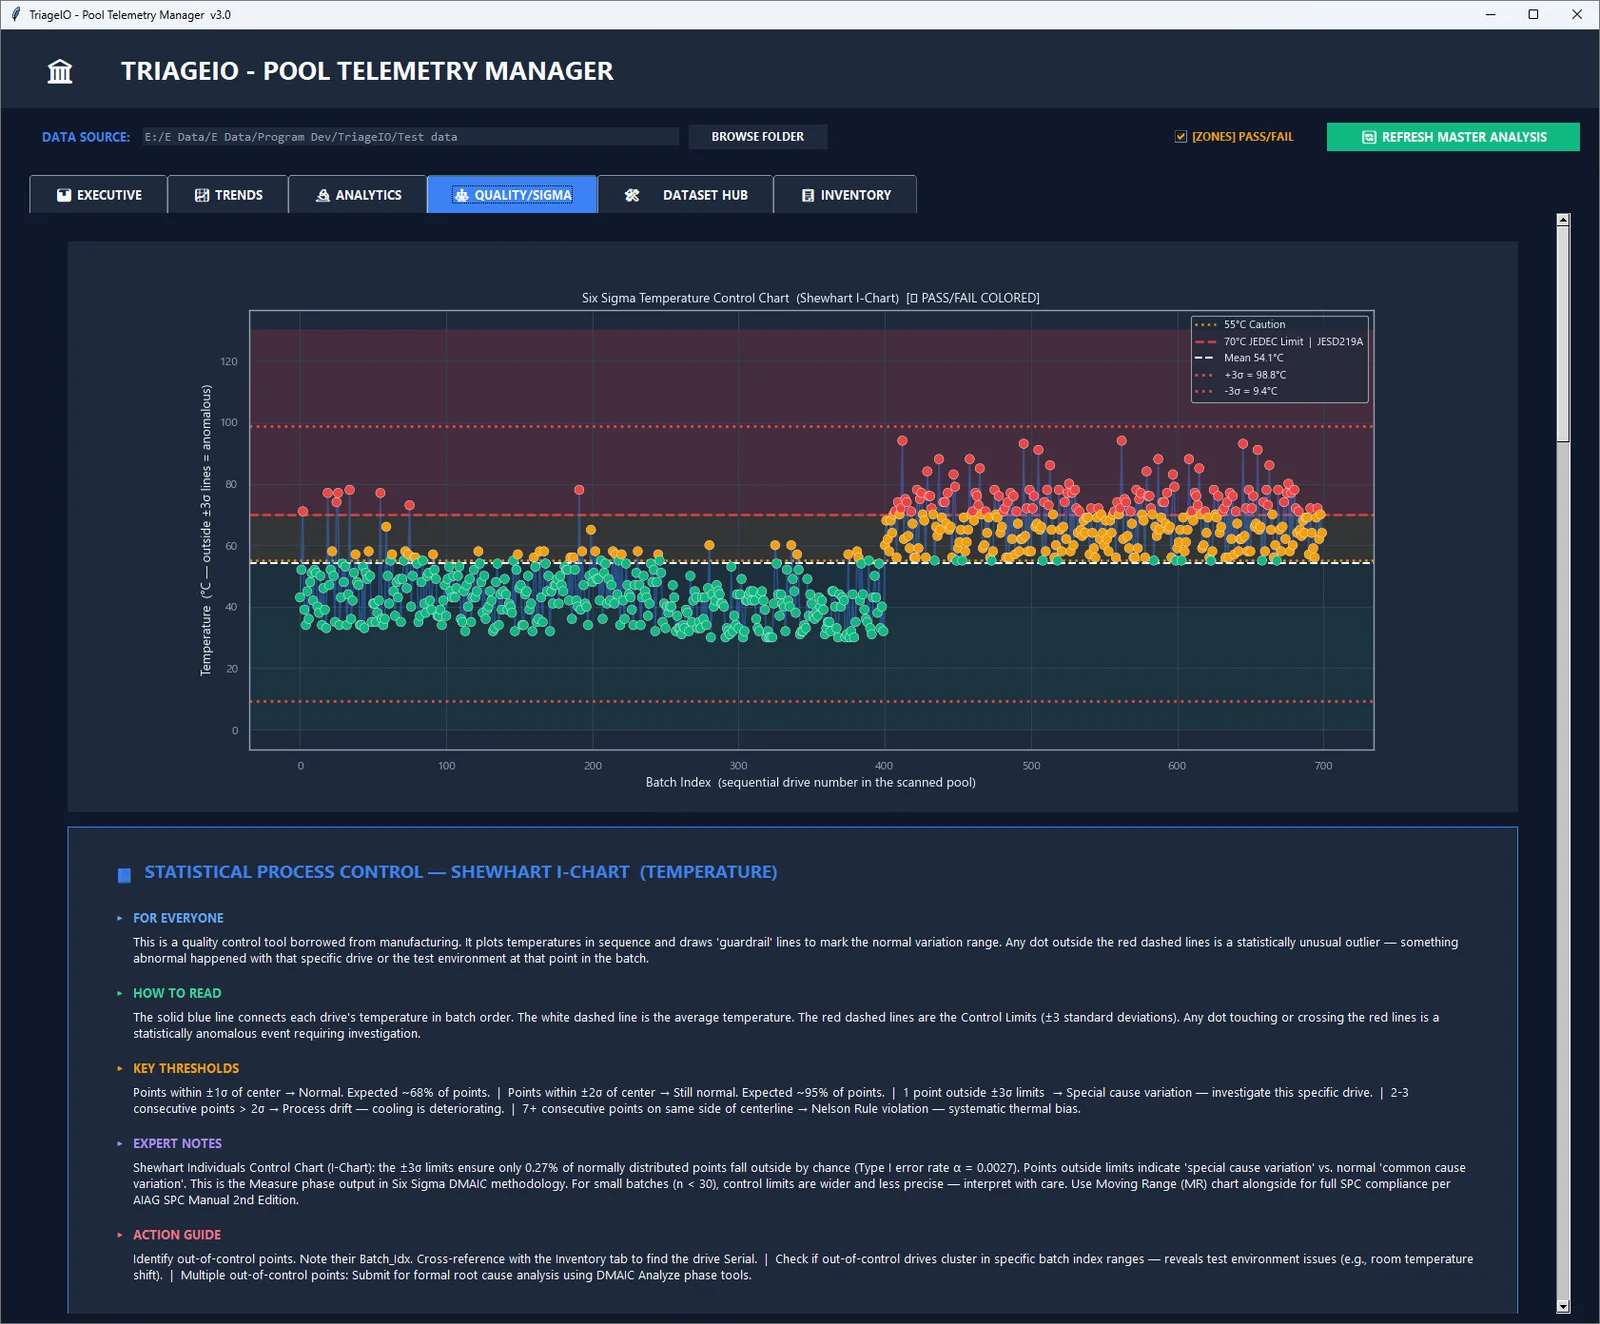
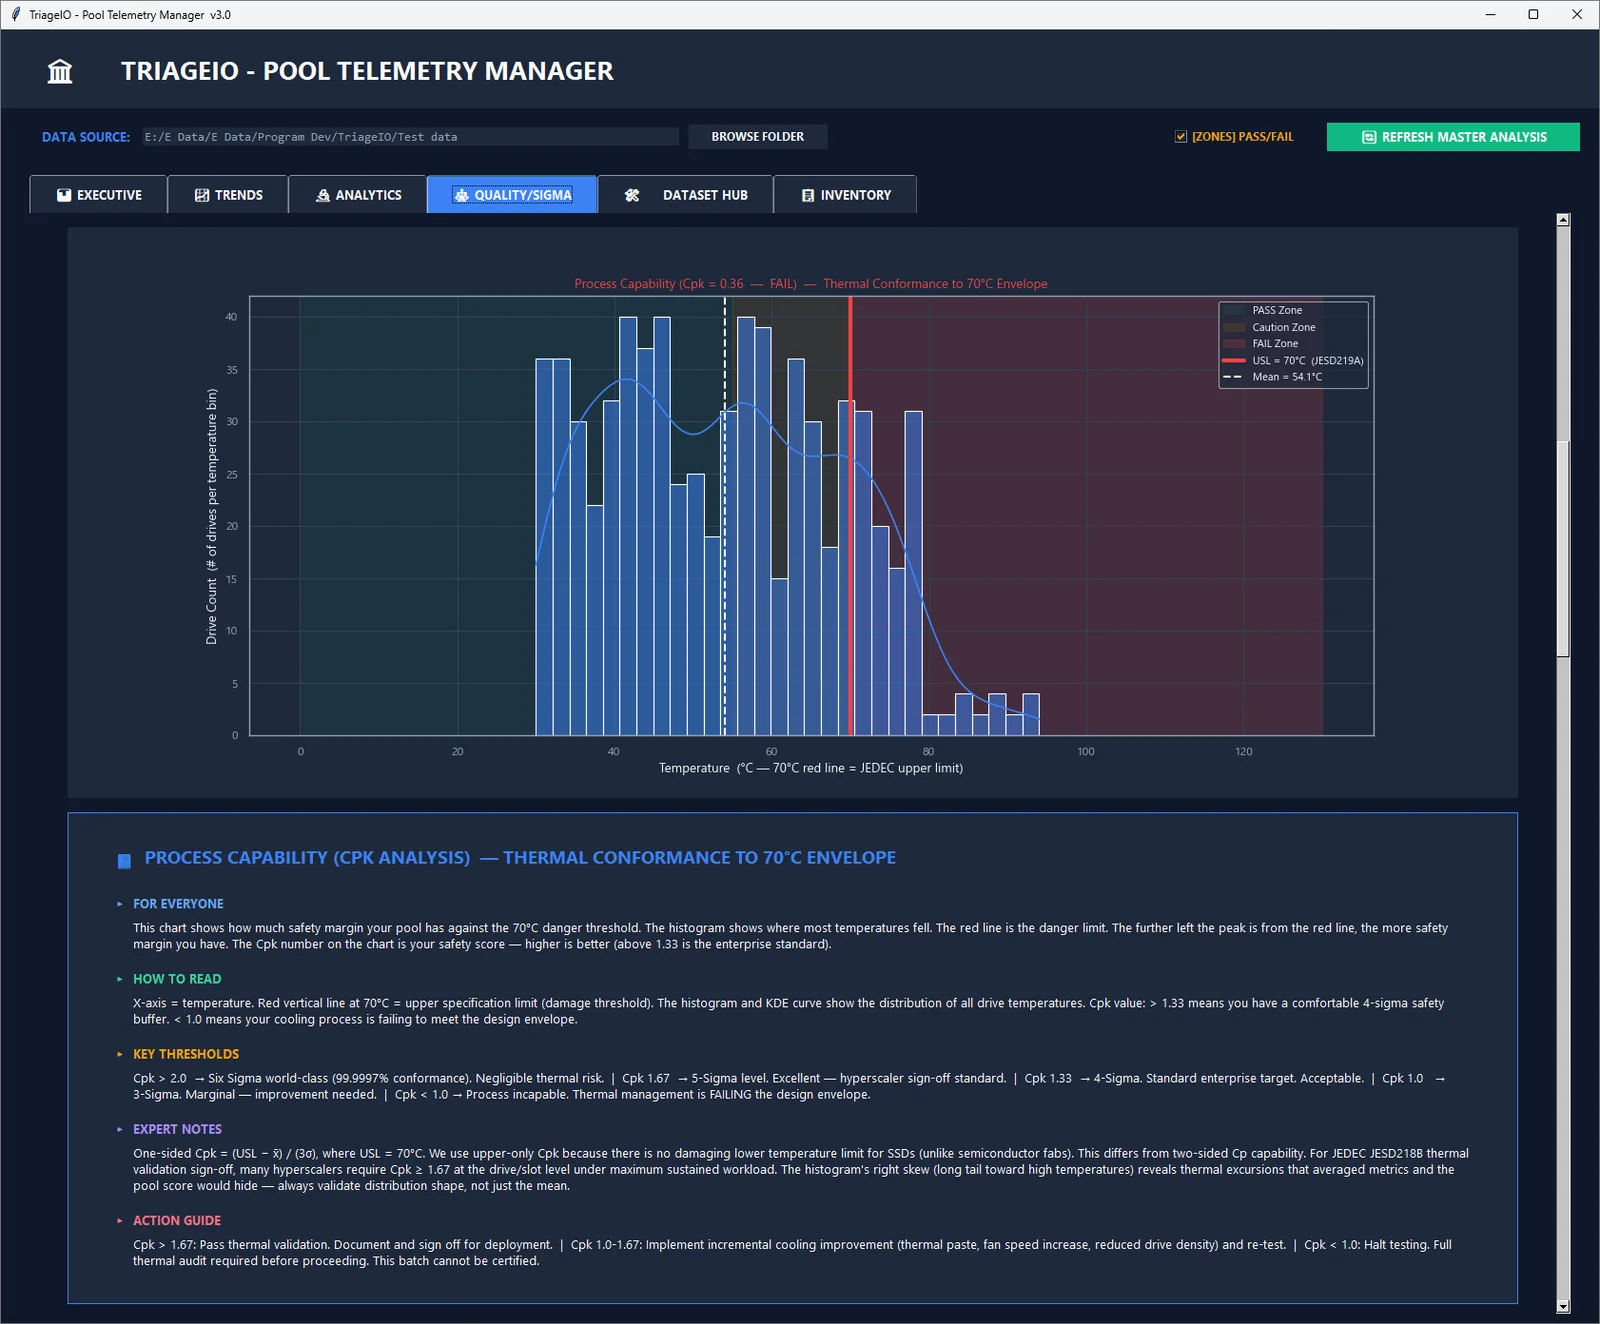
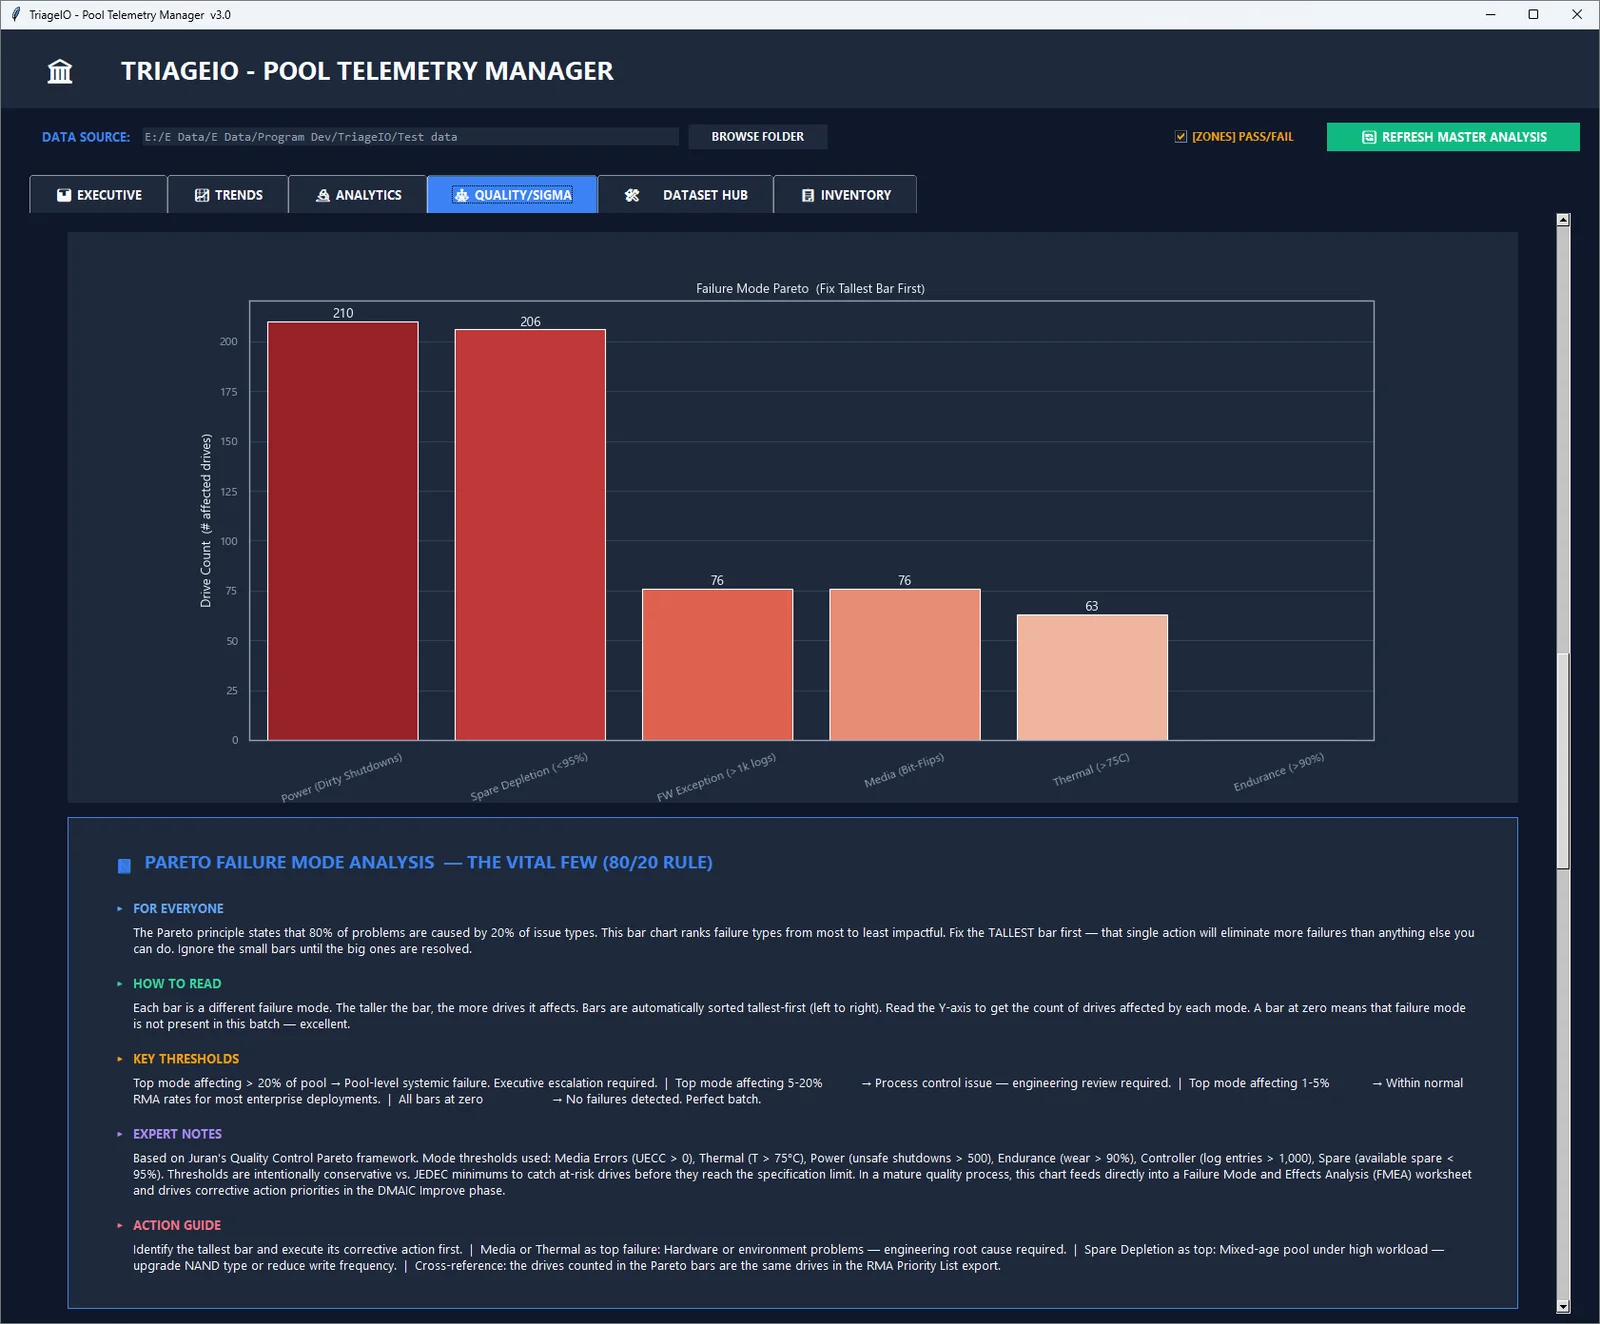
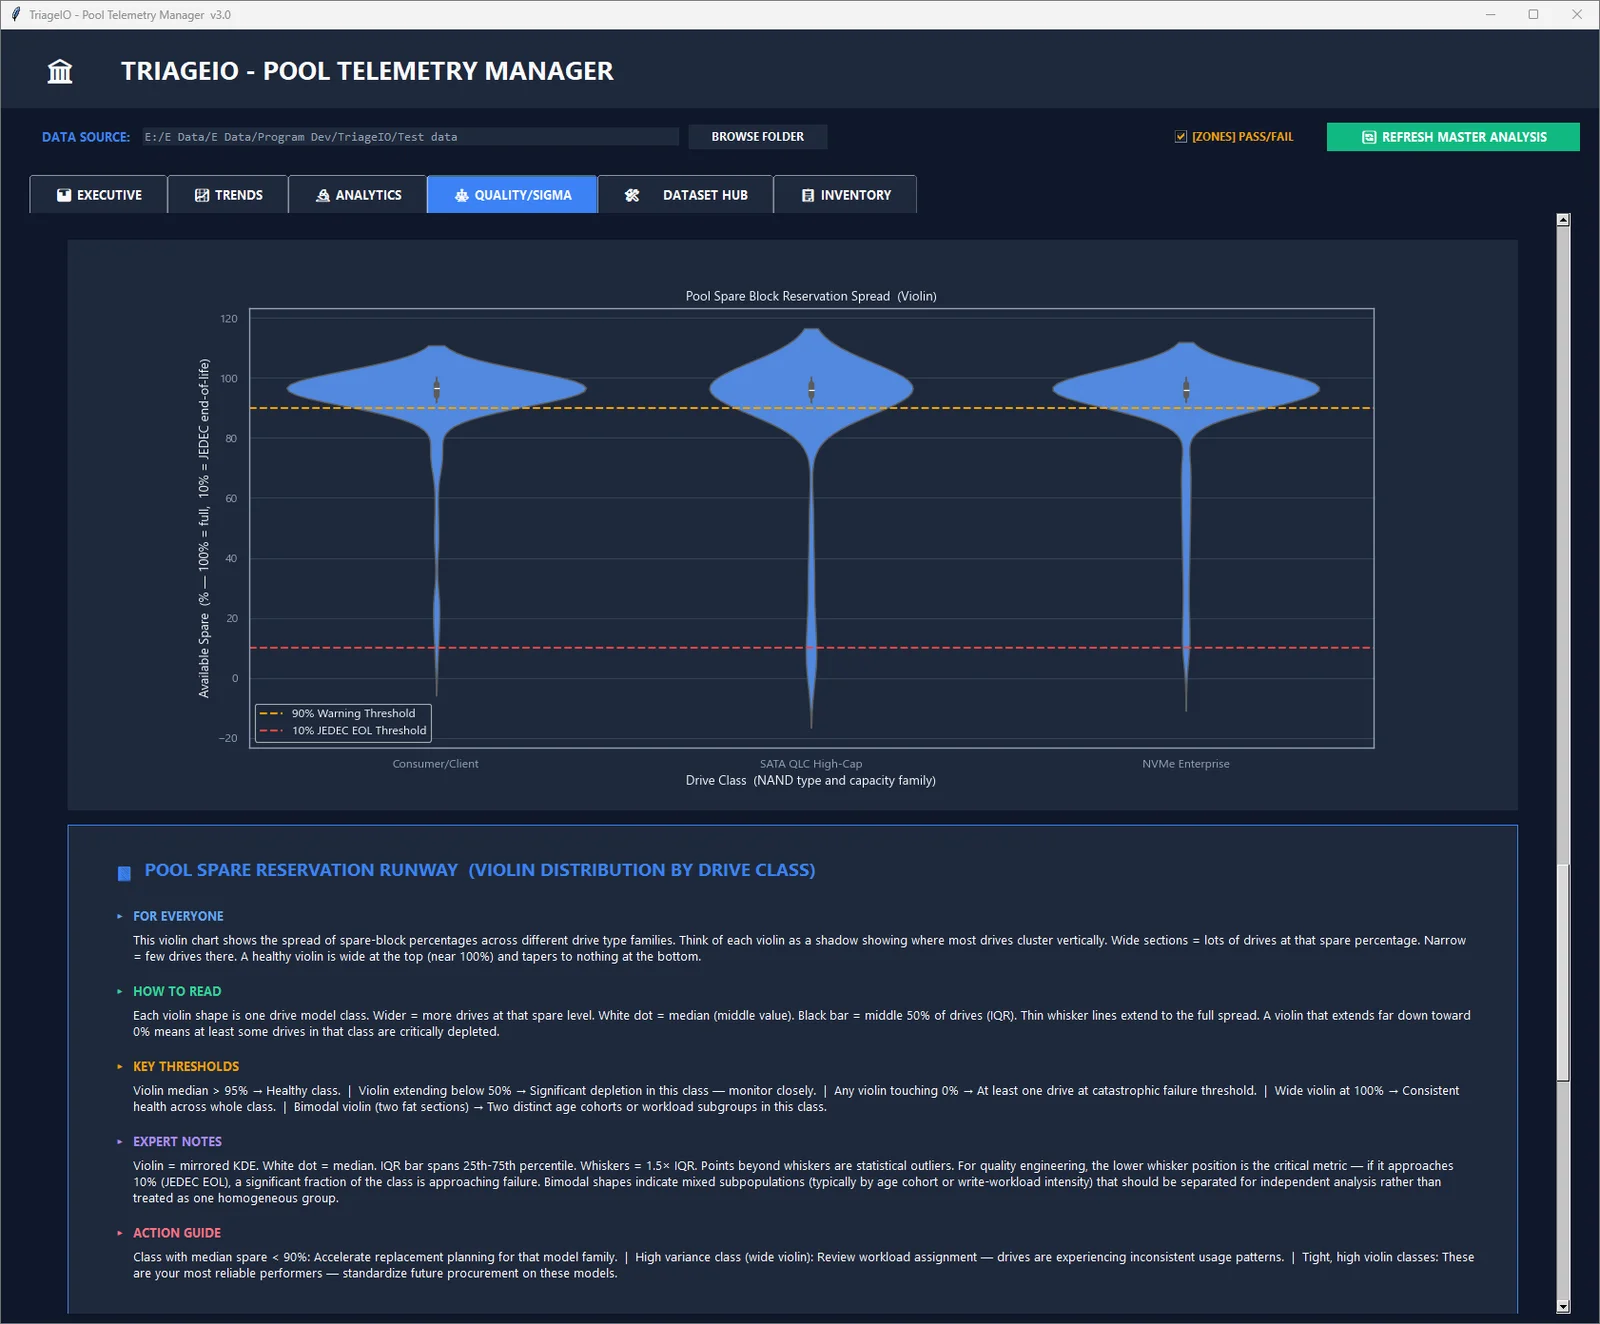
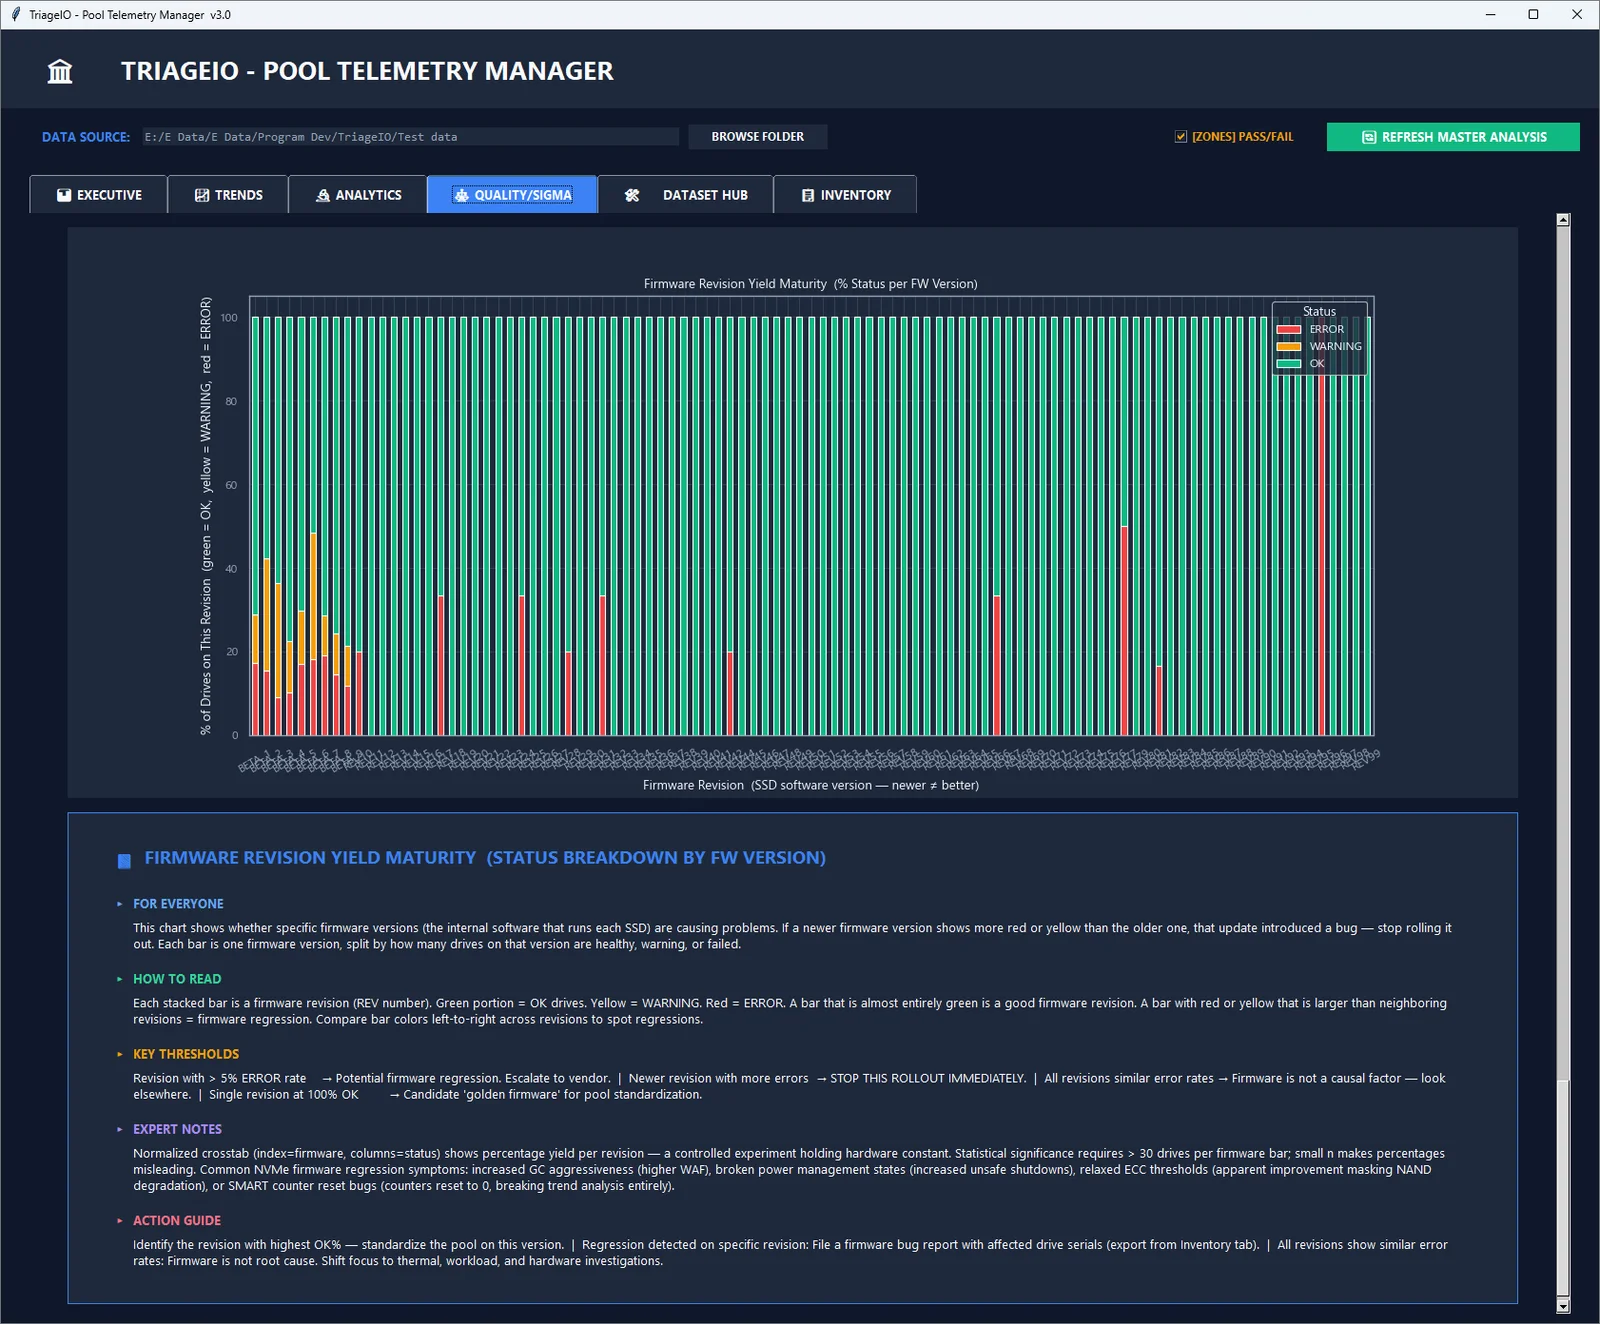
Shewhart I-Chart for temperature with mean and ±3σ control lines, Cpk histogram against a 70°C USL, failure mode Pareto, available spare violin plot by drive class, and firmware revision maturity stacked by health status. It shows whether pool temperature stays under statistical control.
Dataset Hub
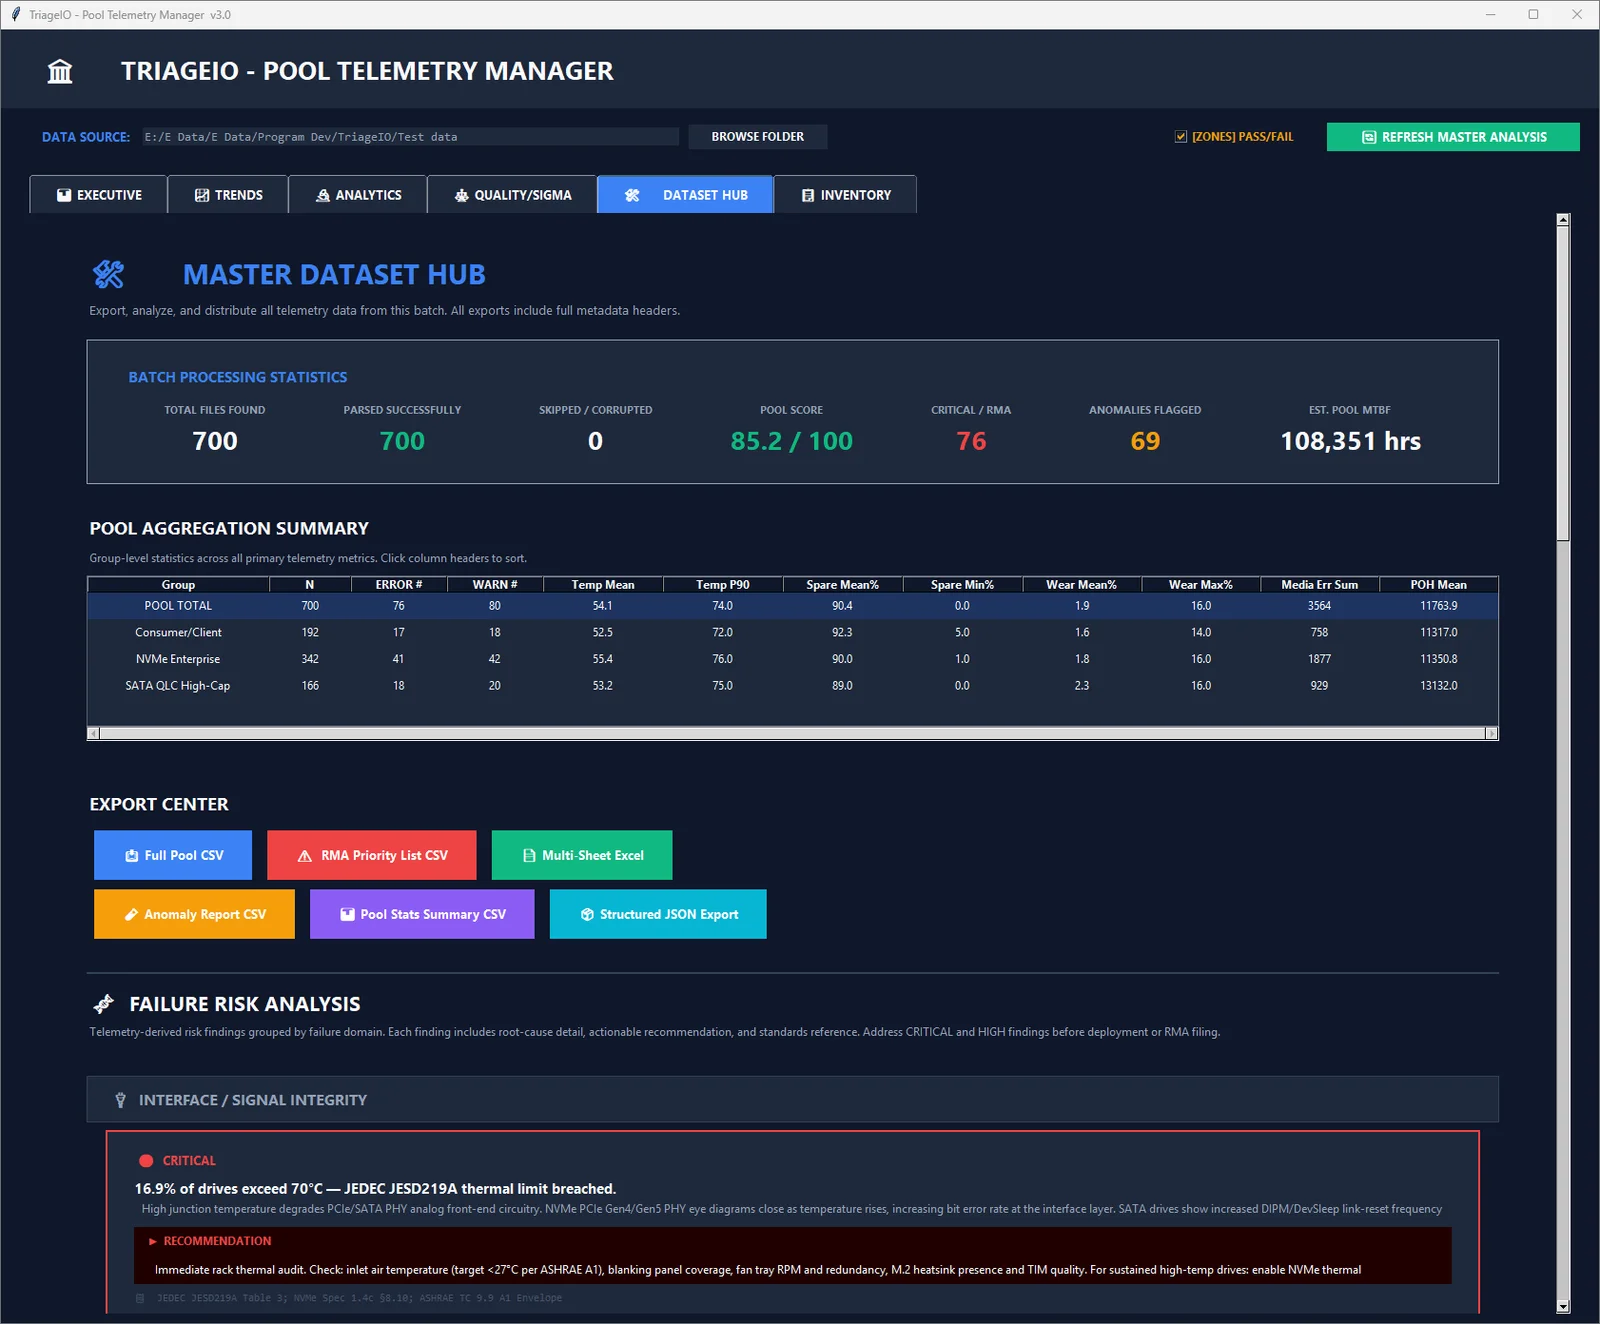
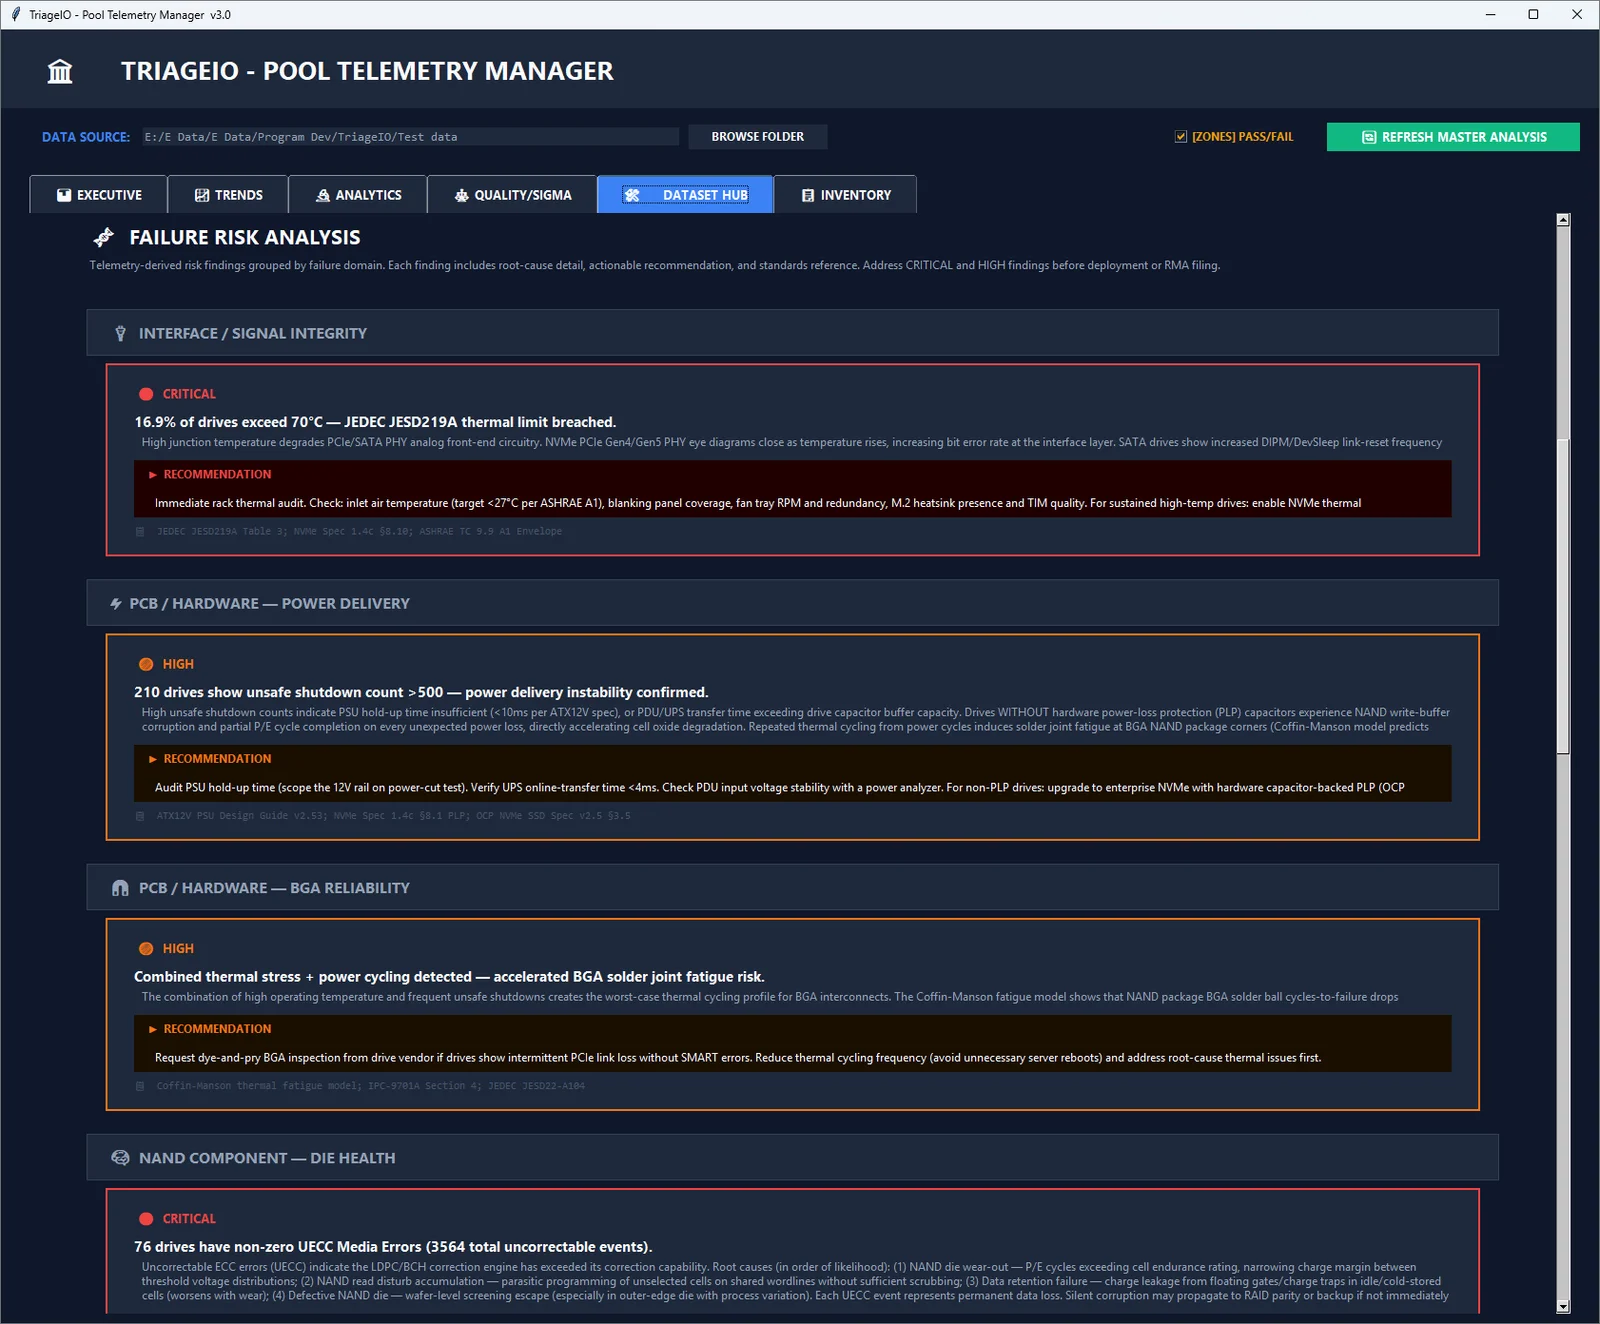
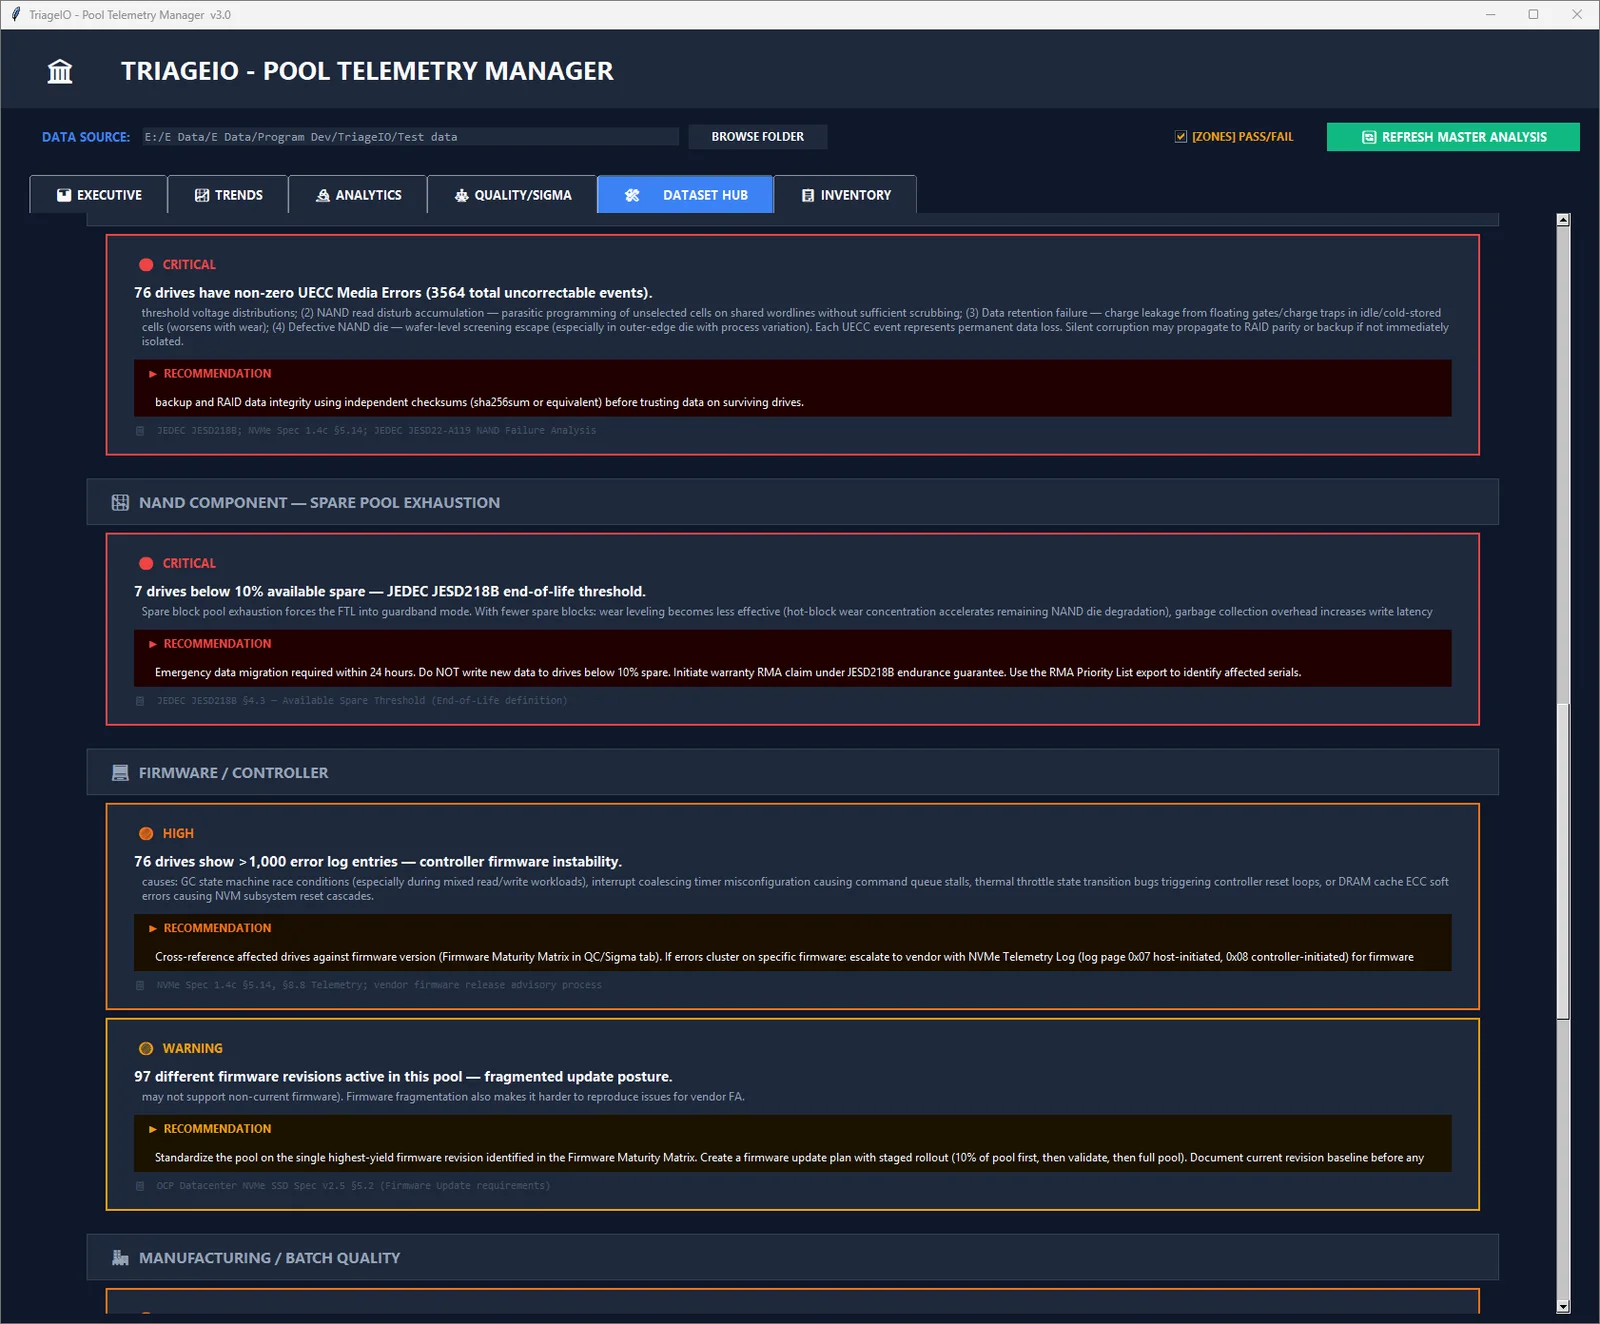
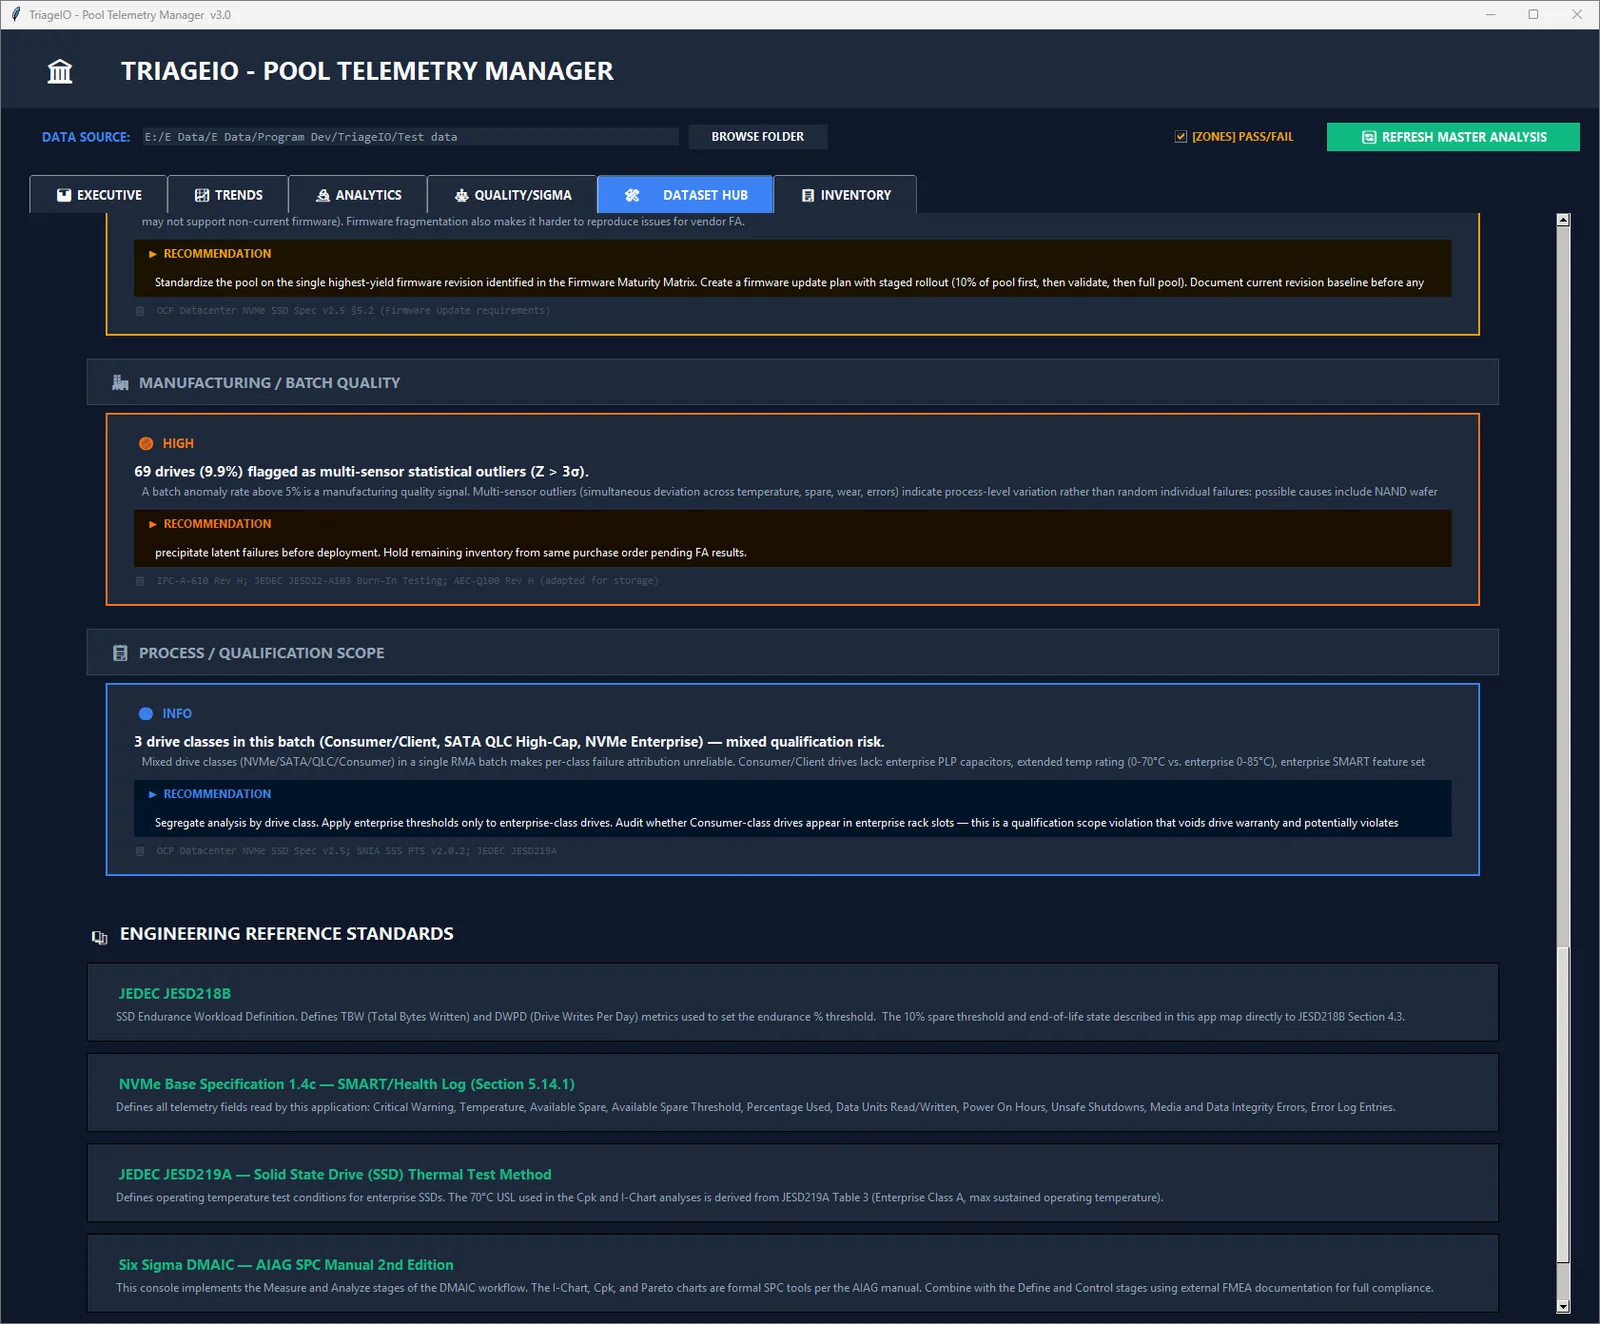
Central operations panel. Batch stats, parse error preview, pool aggregation summary, one-click exports, and structured failure risk analysis grouped by engineering domain with risk levels, recommendations, and standards references.
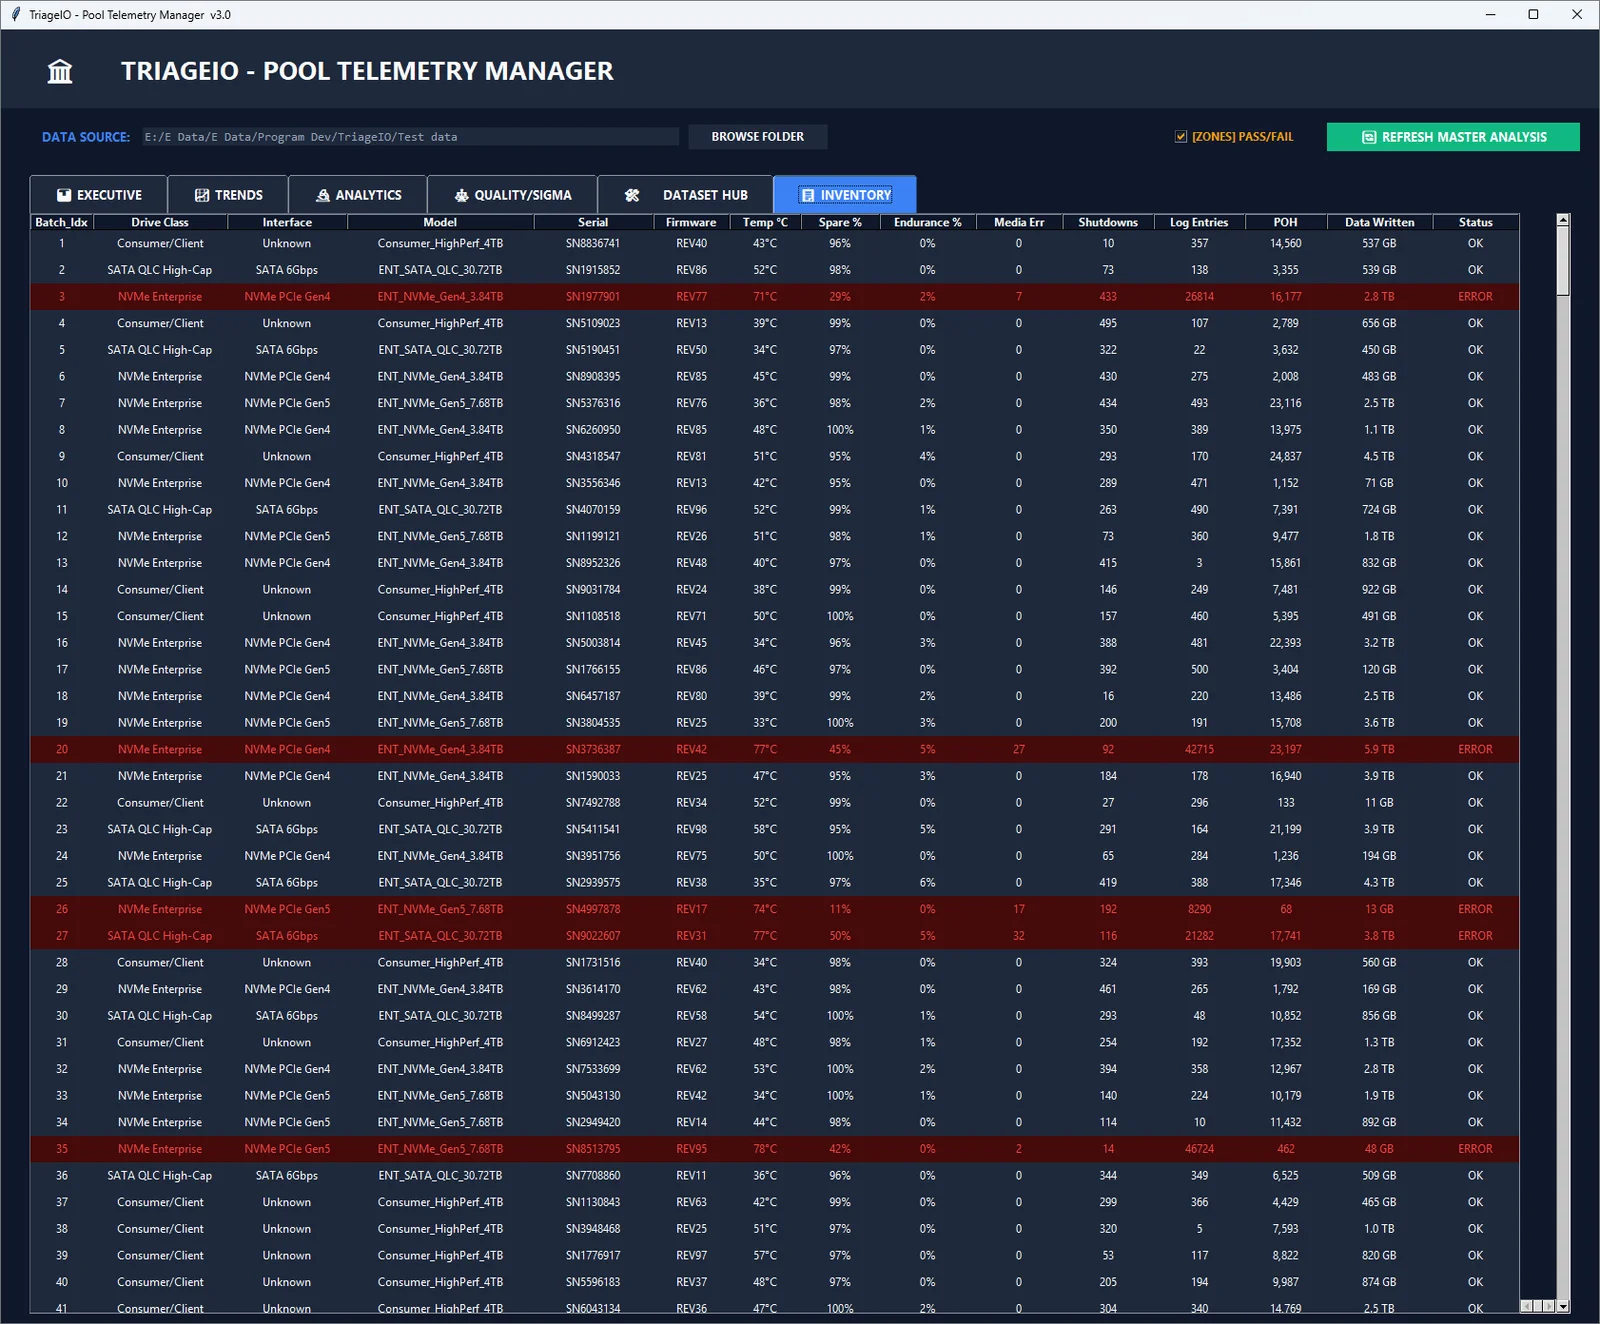
Inventory
A sortable table of every drive with its metrics and status flag.
The analytics engine
Every statistic lives in triageio/analyzer.py, and the sections below show what each one actually computes.
Fleet score
A Pool Mission-Readiness score from 0 to 100 starts at 100 and subtracts three penalties. The fraction of drives in ERROR (0 to 1) is multiplied by 50, the fraction in WARNING by 20, and the pool’s average temperature costs half a point for every degree above 40C. A pool where 1% of drives are in ERROR (0.01 times 50) loses half a point from that term, and a pool averaging 60C loses 10. The result is clamped to the range 0 to 100. The Expert Notes text in the app says 1% ERROR costs about 5 points, which overstates it. The code computes 0.5. Every weight is fixed in the code. Use the score to compare one batch with another, since it measures nothing physical.
Anomaly detection
Z-score flagging covers seven columns, namely temperature, available spare, endurance used, media errors, unsafe shutdowns, error log entries and power-on hours. A drive more than three standard deviations from the pool mean on any column is flagged, the flag names each column that tripped, and drives are ranked by their combined score, so a drive that is off on several columns rises to the top of the analytics scatter.
End-of-life prediction
This is a straight-line extrapolation. Wear per power-on hour is endurance used divided by power-on hours, and days remaining is the endurance left (100 minus endurance used) divided by that rate and then by 24, since the wear rate is per hour. It assumes a drive will keep wearing at its lifetime average, and it skips any drive with zero power-on hours or zero wear. The chart lists the 25 drives with the fewest days left.
Cpk
An upper-sided process capability index, (USL minus the pool mean) divided by three standard deviations, against a 70C upper spec limit for temperature.
Estimated MTBF
Total power-on hours across the pool divided by the number of drives in ERROR status. It counts an ERROR status as a failure, and it reads as infinite when no drive is in ERROR.
WAF proxy
Endurance used divided by data written scaled to the pool’s largest writer. Because it is a relative index, it only shows which drives burn endurance faster than their writes suggest, and a drive with zero writes scores 0. It is not a measured write amplification factor.
Normalization and ingestion
TriageIO’s telemetry processor scans the folder you choose, and its subfolders, for .xlsx files. It reads the first sheet, using the Metric and Value columns, or the first two columns if those headers are missing. Field names are matched case-insensitively against the alias table and mapped onto a canonical schema. A few examples of what the table resolves:
| Canonical field | Example aliases resolved |
|---|---|
| Temperature | Composite Temperature, Temperature Sensor 1, Airflow Temperature Cel |
| Available Spare | Spare Available, Spare Block Remaining |
| Endurance Used | Percentage Used, Wear Leveling Count, Media Wearout Indicator |
| Media Errors | Media and Data Integrity Errors, Uncorrectable Error Count |
| Unsafe Shutdowns | Power Loss Count, Unexpected Power Loss Count |
| Power On Hours | Power On Time, POH |
| Data Units Written | Total LBAs Written, Total Bytes Written, Host Writes |
| Error Log Entries | Number of Error Log Entries, Error Information Log Entries |
Aliases such as Life Remaining are inverted (100 minus the value) so that everything ends up on “used”. Numbers are cleaned of commas, percent signs and trailing units, so 43 C and 96% (threshold 10%) become 43 and 96. Model, serial, firmware and device fields are picked up the same way, and TriageIO infers the interface and a drive class from the model and device text.
IOSpeX saves a workbook that already uses this layout, with the metric names above in its first sheet, so a saved result from a drive can go straight into a TriageIO folder.
Status classification uses fixed thresholds:
| Status | Condition |
|---|---|
| ERROR | Media errors above 0, or available spare below 10% |
| WARNING | Available spare below 90%, temperature above 70C, endurance used above 90%, or error log entries above 1,000 |
| OK | Everything else |
Exports
Everything comes out of the Dataset Hub with one click:
| Export | Format |
|---|---|
| Full Pool Data | CSV |
| RMA Priority List | CSV |
| Anomaly Report | CSV |
| Pool Stats Summary | CSV |
| Multi-sheet workbook | Excel (Pool Data, RMA Priority List, Aggregations, Anomaly Report, EOL Predictions, Percentiles) |
| Full structured export | JSON (metadata, percentiles, aggregations, anomalies, EOL and the full pool) |
Use the JSON export if you are feeding TriageIO into a larger pipeline or archiving a complete pool snapshot to compare across test cycles.
Sample data
Synthetic .xlsx telemetry sits in three folders under Test data in the repository, covering a primary sample pool, an aging fleet and an unstable-thermal fleet. Every drive in them is made up. Point the app at one to see what a healthy pool, a worn pool and a hot pool look like before you use real exports. Their generator is not part of the repository.
Limitations
It analyzes exports, not live drives
It reads .xlsx files you point it at. There is no live ingestion, and it does not query drives itself.
Missing fields get defaults, not warnings
If an export has no value for a metric, TriageIO fills in temperature 0, available spare 100 and zero for the rest, so a drive that never reported media errors looks clean on that field.
Some aliases are loose stand-ins
In the code, a few SATA attributes stand in as proxies for NVMe fields (for example Reallocated Sector Ct as media errors, and Controller Busy Time as error log entries). SATA status is approximate.
Data Units Written is taken as exported
Different vendors report bytes, LBAs, sectors or units, and there is no unit conversion, so the WAF proxy and the endurance regression are only meaningful when the sources agree.
The thresholds are fixed
Status limits, the 70C spec limit and the score weights are constants in the code. A pass/fail zone toggle draws them on the charts and does not change them.
Trends follow file order
Trend charts plot files in sorted path order and ignore timestamps, so they show a time trend only if your file names sort chronologically.
The risk report is fixed commentary
Engineering text and standards references in the Dataset Hub are written into the code and selected by simple thresholds on the pool. Treat them as prompts to investigate, since nothing in them was written about a specific drive.
Drive class and interface are guessed
Drive class and interface are guessed from keywords in the model and device text, and unfamiliar models fall back to a generic class.
Windows desktop only
Its README lists Windows, and the repository has no automated tests.
Get started
You need Windows and Python 3 with Tkinter, which the standard Windows installer includes. No Python version is pinned in the README.
git clone https://github.com/TurboStorage/triageio.git
cd triageio
pip install -r requirements.txt
python TriageIO.py
You can also download the repository from GitHub as a ZIP instead of cloning it. It needs pandas, numpy, openpyxl, tabulate, matplotlib and seaborn. TriageIO.bat launches the app silently through pythonw.
In the app, use Browse Folder to pick the folder of .xlsx files. Analysis starts as soon as you choose it, and Refresh Master Analysis re-reads the folder. To try it first, pick one of the folders under Test data.
A legacy command-line path prints a summary and writes a CSV without the GUI:
python -m triageio.main --results-dir "Test data/results" --rma-onlyIt writes rma_analysis_report.csv to the current folder unless you pass --output-csv, and it lists outliers at 1.5 standard deviations, tighter than the app’s 3. Its README calls the desktop app the primary interface.
Safety
It only reads the files you point it at
TriageIO opens the input workbooks for reading only and never modifies them, so the exports stay as they came from each vendor tool.
It writes only what you export
Exports go where you choose in the save dialog. The legacy CLI writes its CSV to the current folder or the path you give.
It never touches a drive
TriageIO has no device access and no administrator requirement, and it makes no network connection, so it works only on the files you point it at.
Exports contain serial numbers
Pool data, the RMA list and the JSON carry model, serial and firmware from your source files. Remove them before you share an export.
License
TriageIO is open source under the MIT License, copyright 2026 Sean Webster. The LICENSE file is in the GitHub repository.