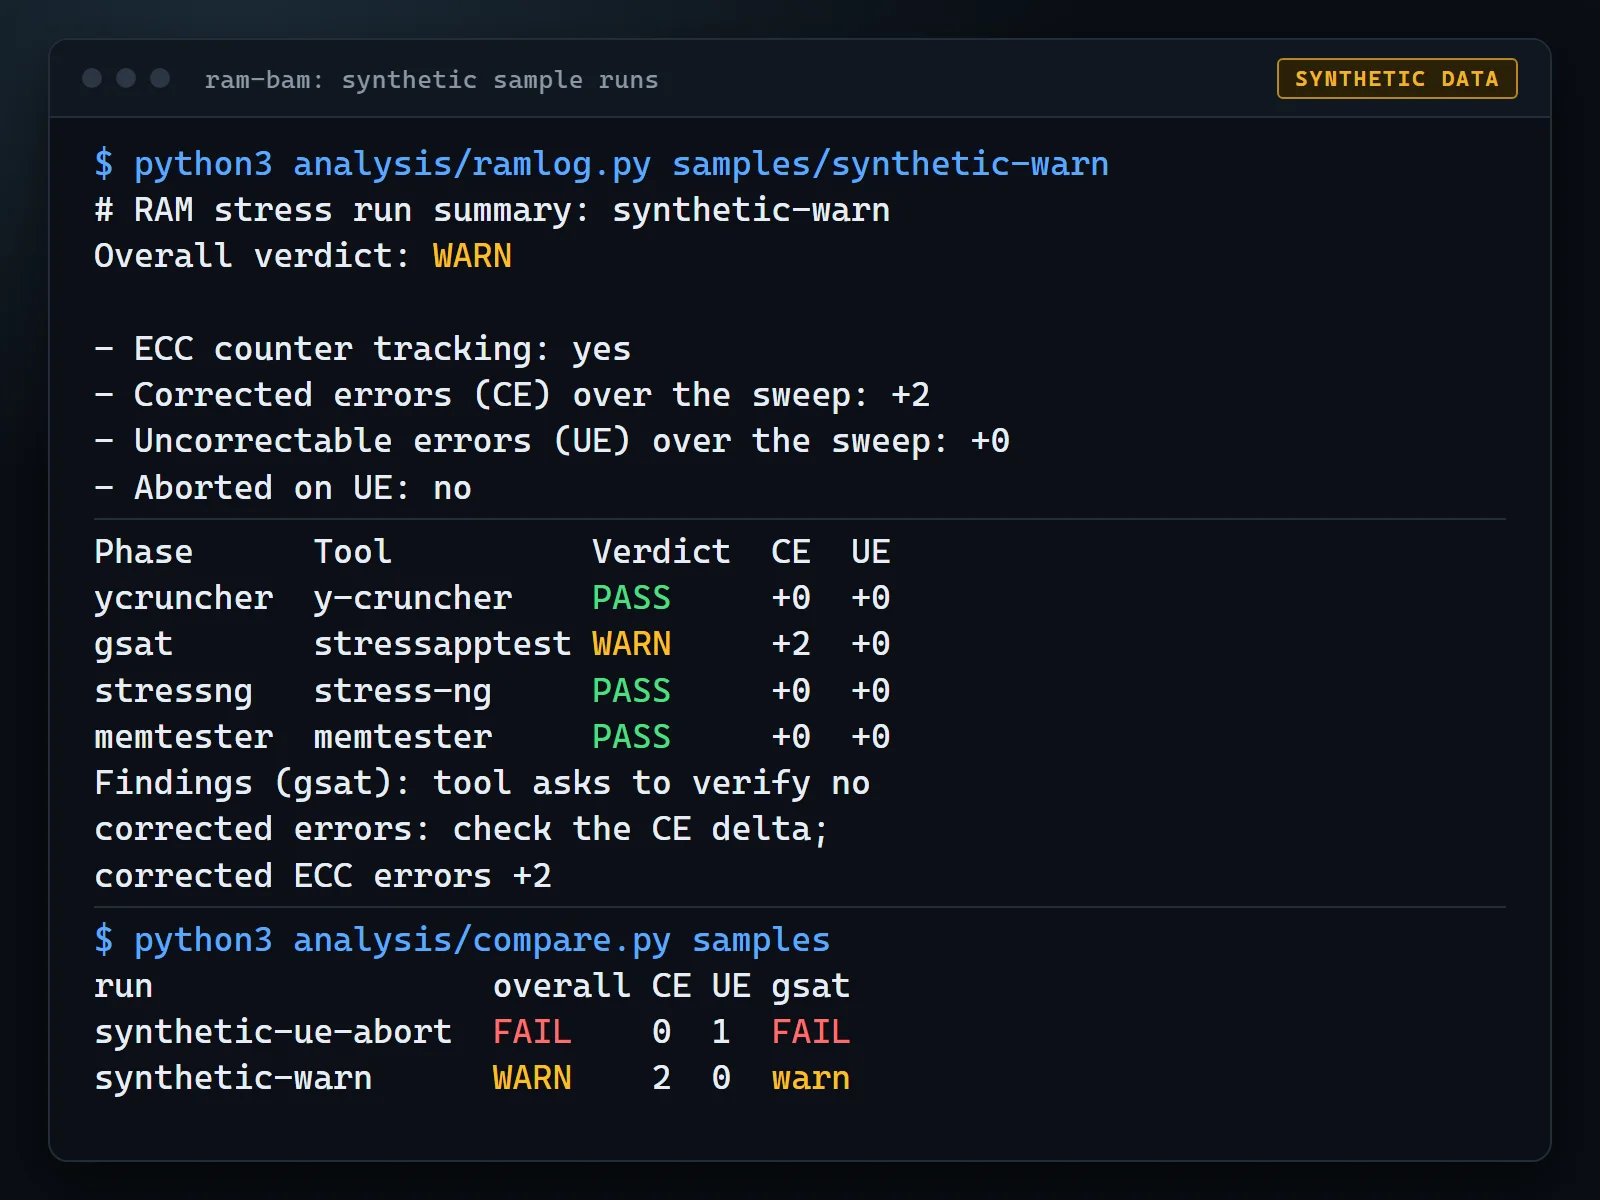
PS-FU sits in the Reliability and validation group on the software page, next to RAM BAM, a script set for stress-testing ECC DDR5. PS-FU covers the whole machine (CPU, GPU, RAM, storage and power supply) and keeps the raw telemetry behind each verdict.
Introducing PS-FU: Platform Stress & Failure Utility
Most stress tools tell you a machine stayed up. Fewer tell you what you can defensibly say about a part that misbehaved. PS-FU is a Python tool for validating PC hardware (CPU, GPU, RAM, storage and power supply). It answers a narrower question. Did this part misbehave under load, and what does the evidence support? It is a bench tool: it produces no score to compare against other people’s machines.
Why PS-FU Exists
A pass/fail from a stress run is only useful if someone else can check it. Sensor logs scroll away, a kernel error message gets missed, and a claim like “the 12V rail was fine” is easy to make and hard to defend when the only instrument was a software sensor. That is why it keeps the raw telemetry, watches the kernel log while the load runs, and writes down how far the evidence actually goes.
What it does
A run follows a profile, which is a JSON list of phases. The load comes from stress-ng, gpu-burn, memtester-style workers and fio, and PS-FU then:
- Samples about 140 columns once a second into SQLite: NVML,
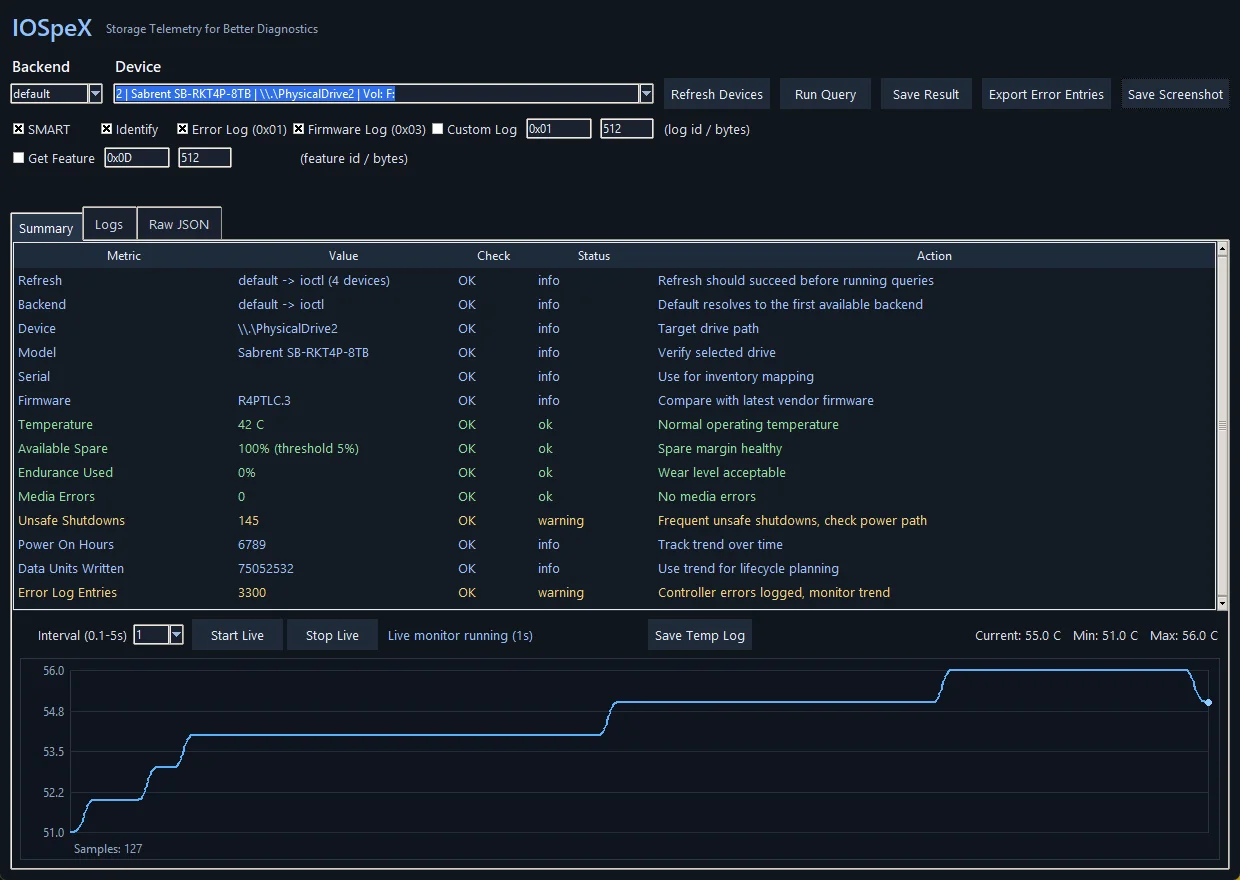
sensors, turbostat and RAPL,/proc, EDAC counters, PCIe AER counters, NVMe SMART, OCP vendor logs, Corsair PSU telemetry and NUT UPS state. - Watches the kernel log for machine checks, AER, NVMe timeouts and resets, GPU Xid errors, thermal and brownout messages.
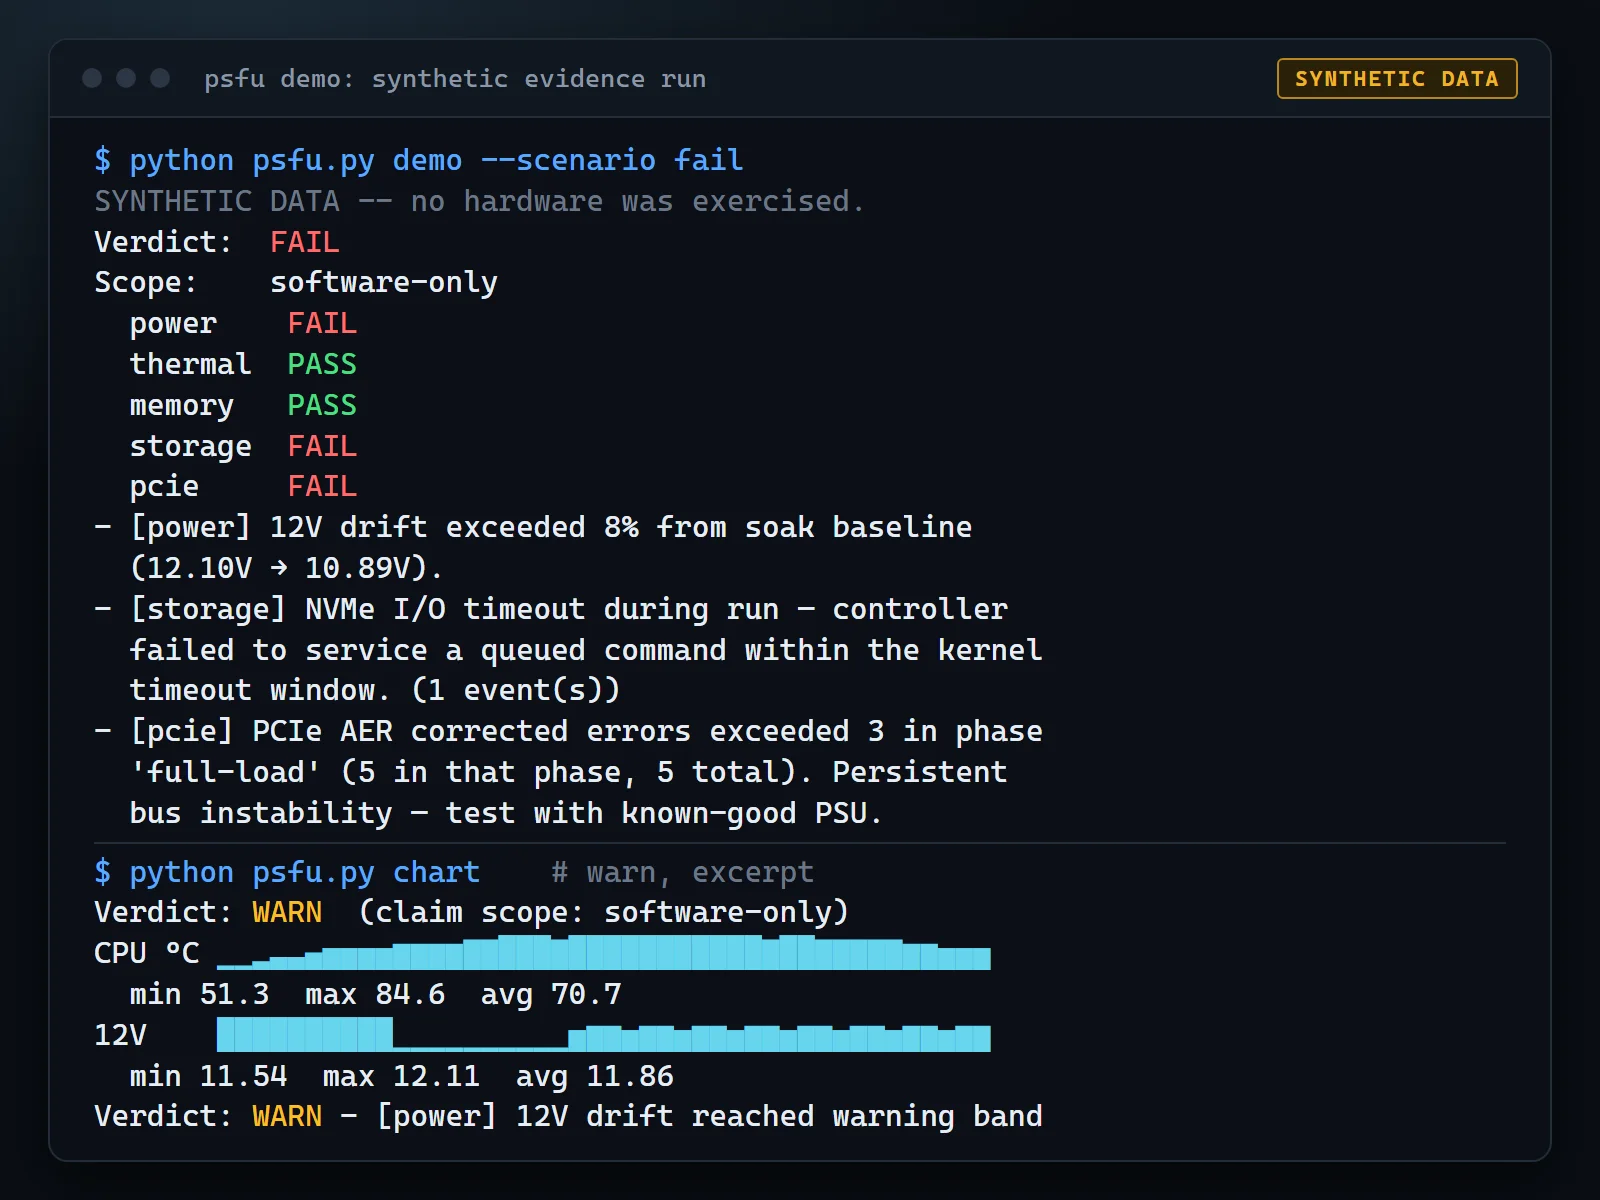
- Scores the run per subsystem (power, thermal, memory, storage, pcie) as PASS, WARN or FAIL, with the reason attached.
- Writes an evidence bundle:
run.sqlite,samples.csv,events.csv,verdict.json,summary.md, charts and abundle.sha256over the key files, so a post-run edit is detectable.
A few pieces of the analysis go further than a threshold check. NVMe write-cliff detection looks at 10-second windows of fio bandwidth and compares them to the peak. Western Electric run-rules and CUSUM check the 12V rail and catch a slow sag that stays inside the fixed 4% and 8% drift bands. And the verdict carries a claim scope. Without a multimeter reading it is labeled software-only, and the conclusion text declines to claim rail compliance. Scoring reads only the SQLite file, so psfu rescore can replay any stored run through the current rules and show what changed.
Honest limitations
This is alpha software (0.1.0), and the README is blunt about it.
The scoring protocol is not independently validated
Version 0.22 of the scoring protocol is pre-1.0. Thresholds such as the 4% and 8% 12V bands are engineering judgement tuned on a small number of benches, not values from a standard.
Software sensors are not a multimeter
Ripple, transient response, absolute rail compliance and over-current trip points are out of scope. So a verdict without a multimeter reading is labeled software-only.
Real runs are Linux only
On Windows you get demo mode, re-scoring, reports and the test suite.
Hardware coverage is narrow
It was developed on a small set of platforms and a few NVMe and SATA drives. The GPU path is NVIDIA only.
An operator is expected to be present
There is no unattended mode. An operator is expected to be present, and the full profile runs about 50 minutes.
The 510 tests stub out hardware access, so they exercise parsing, scoring and report logic rather than real devices.
Get started
Python 3.10 or newer, standard library only for the core tool:
git clone https://github.com/TurboStorage/psfu && cd psfu
python -m pip install -e .
python psfu.py demo --scenario warn    # pass | warn | fail, no hardware needed
python psfu.py list
python psfu.py chart <run-folder>
On a Linux bench machine, python psfu.py preflight shows which external tools are present and python psfu.py bootstrap builds what is missing. Then:
python psfu.py run --profile smoke-v1 --dry-run --no-tui   # 30 s collector check
python psfu.py run --profile system-full-v1 --psu-wattage 1000 --psu-serial <serial>
python psfu.py verdict <run-folder>
Start with the demo and the 30-second smoke profile before committing to the roughly 50-minute full profile.
Safety notes
Some profiles overwrite drives. storage-cliff-v1, storage-destructive-v1 and storage-speed-verify-v1 write to raw block devices. Four guards must all pass: --destructive on the command line, "destructive": true in the profile, the operator retyping the run serial, and the target device not being mounted. Those guards are tested, but they are still guards on a tool that erases disks, so read psfu/storage/destructive_guards.py before pointing one at anything.
The power budget check is heuristic. It warns and records the shortfall when the PSU looks undersized, but it never blocks a run. The tool also does not bundle its external tools, and each keeps its own license.
Open source under the MIT license
PS-FU is open source under the MIT License. Source, profiles, sample output and the architecture notes are on GitHub. Read the Limitations section of the README before trusting a verdict, and treat a PASS as one piece of evidence rather than a certificate.