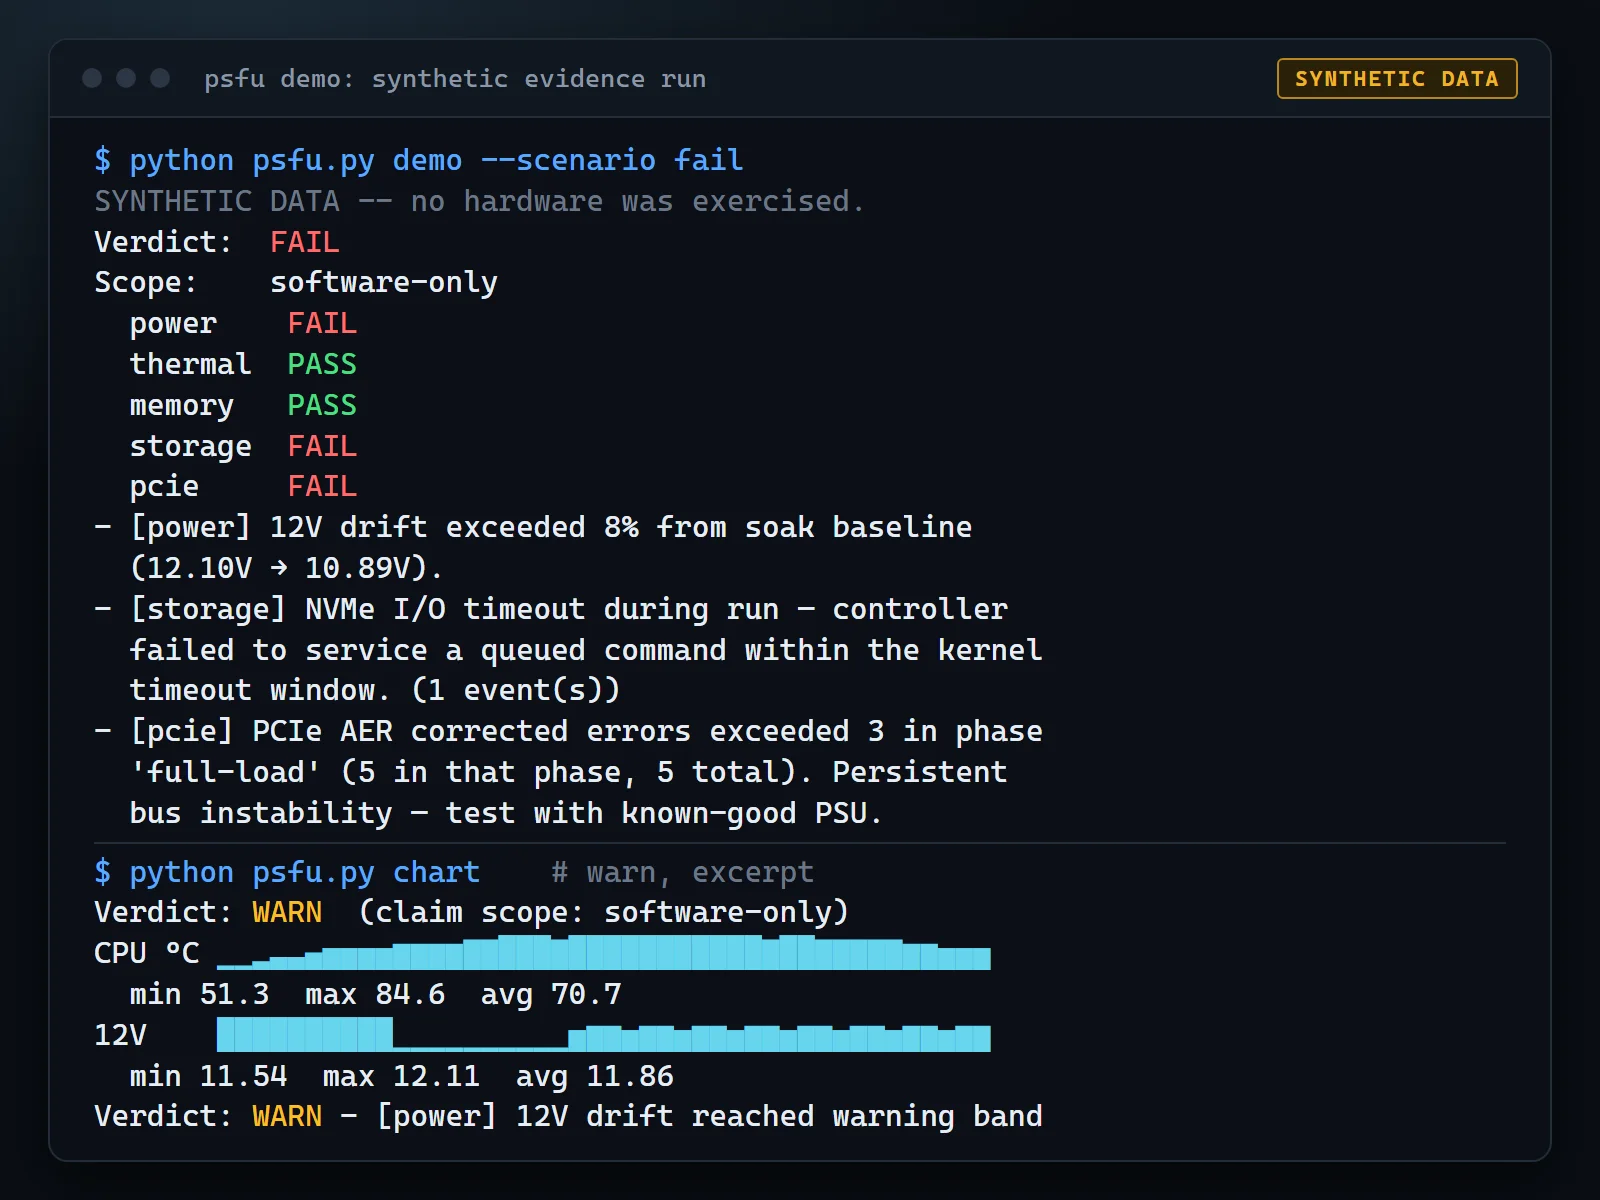
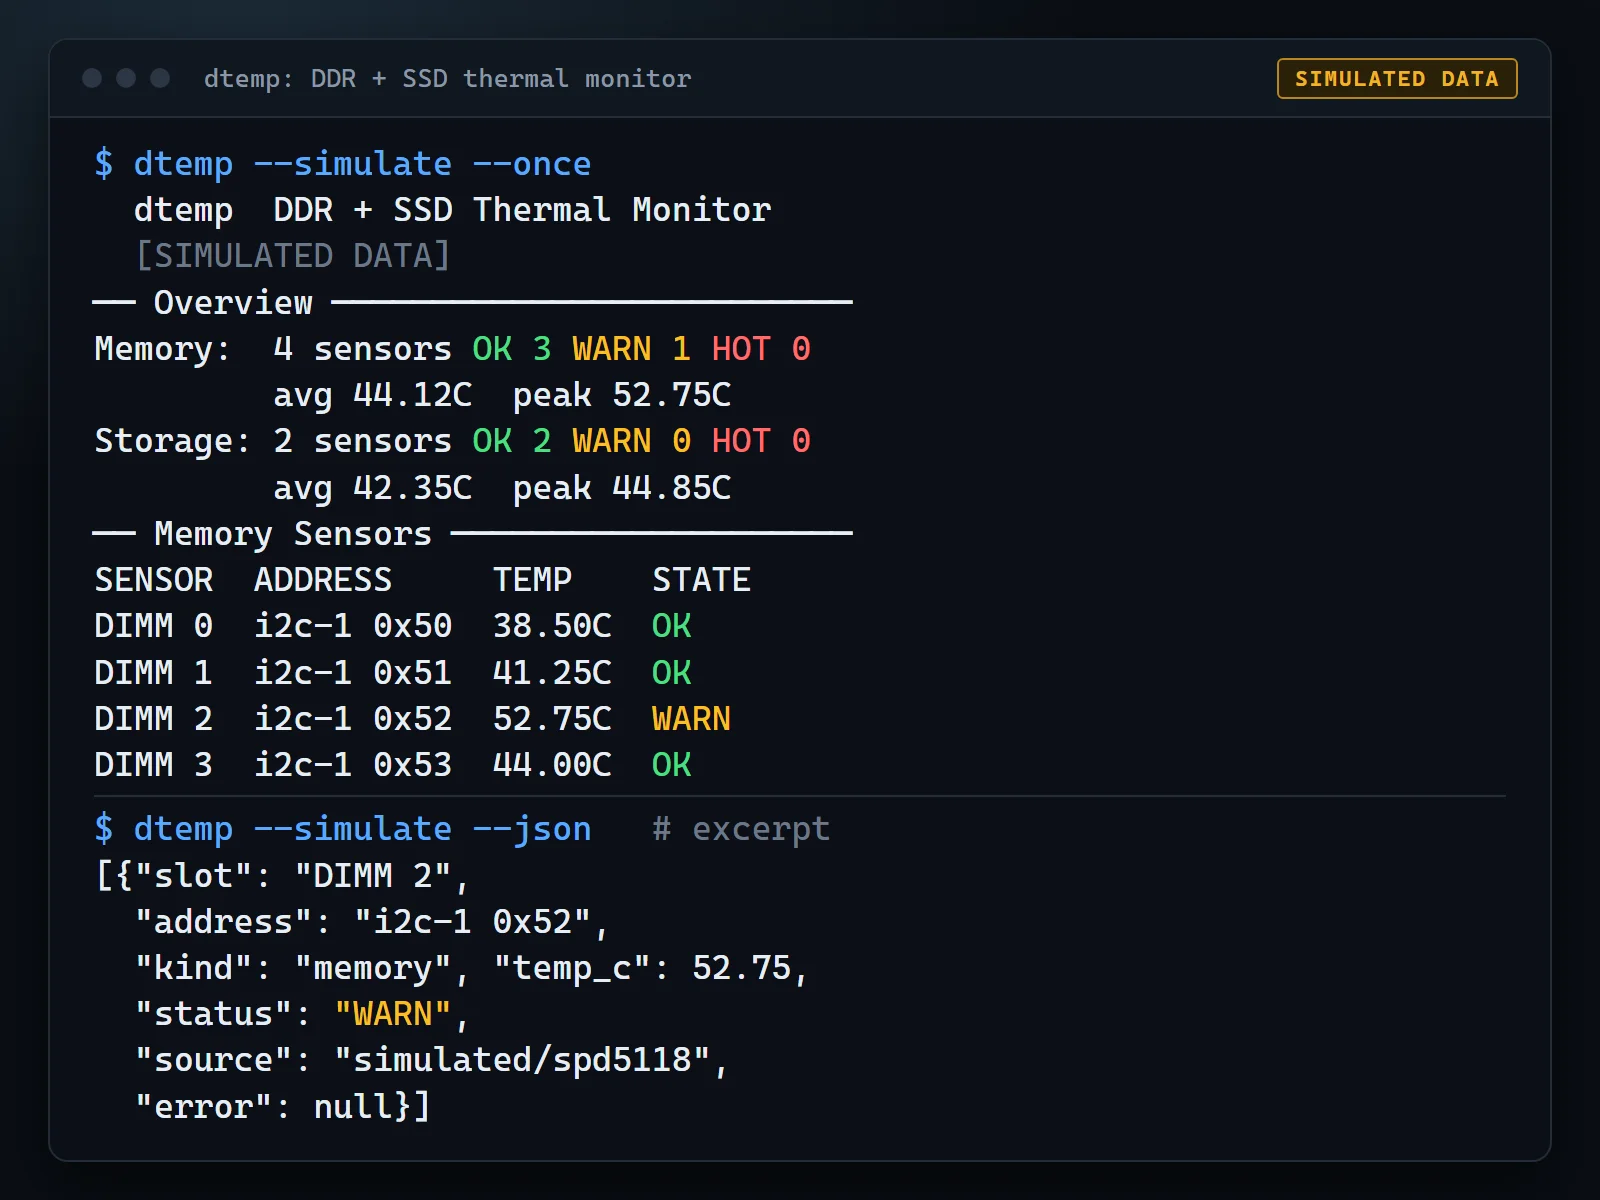
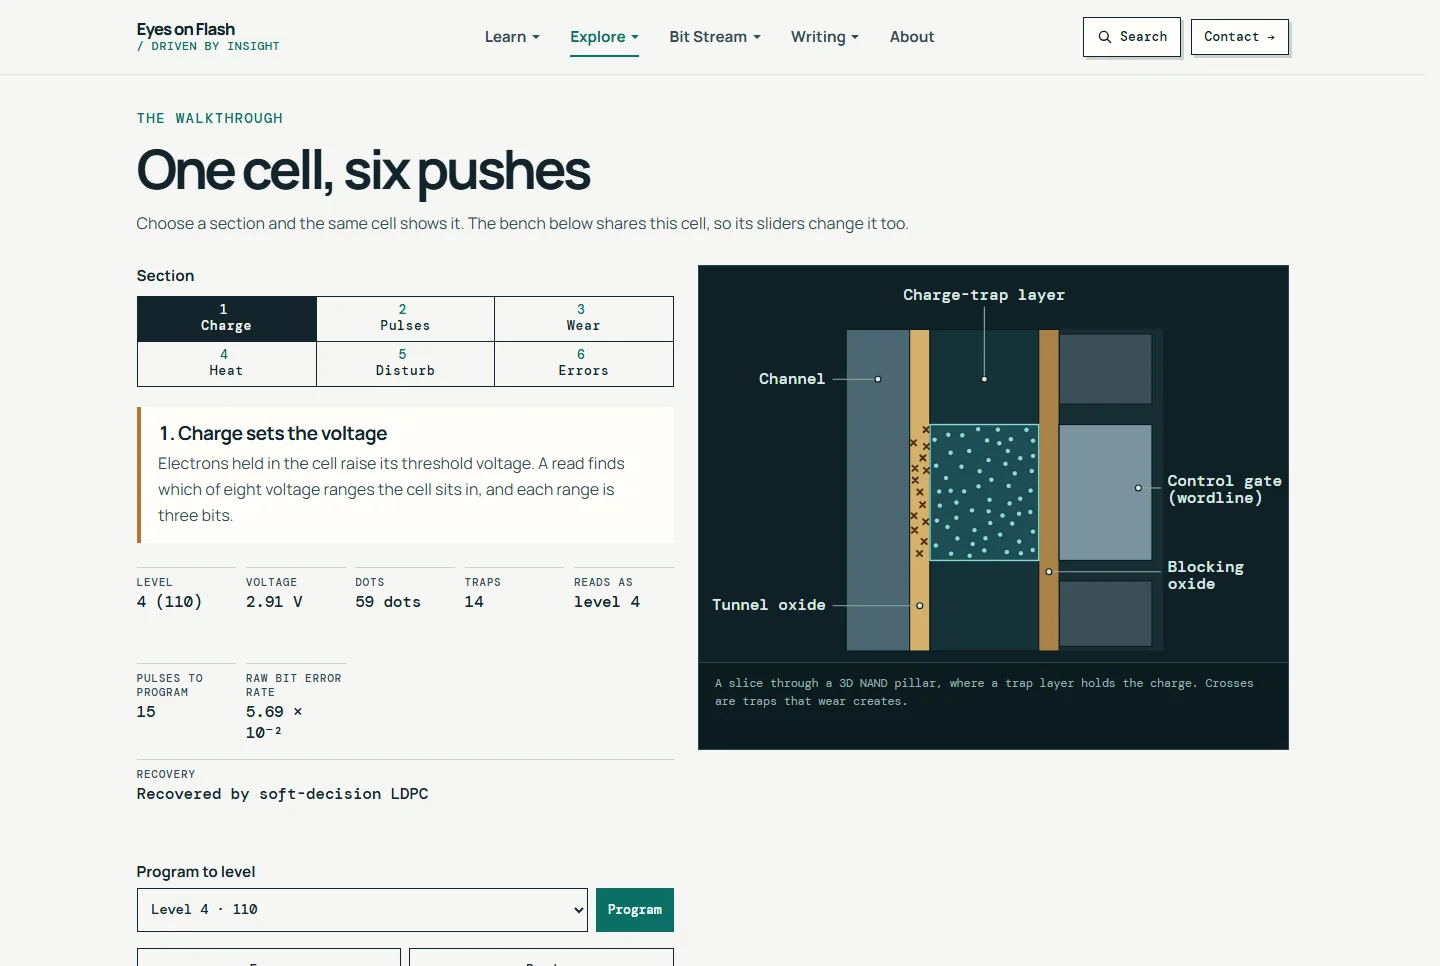
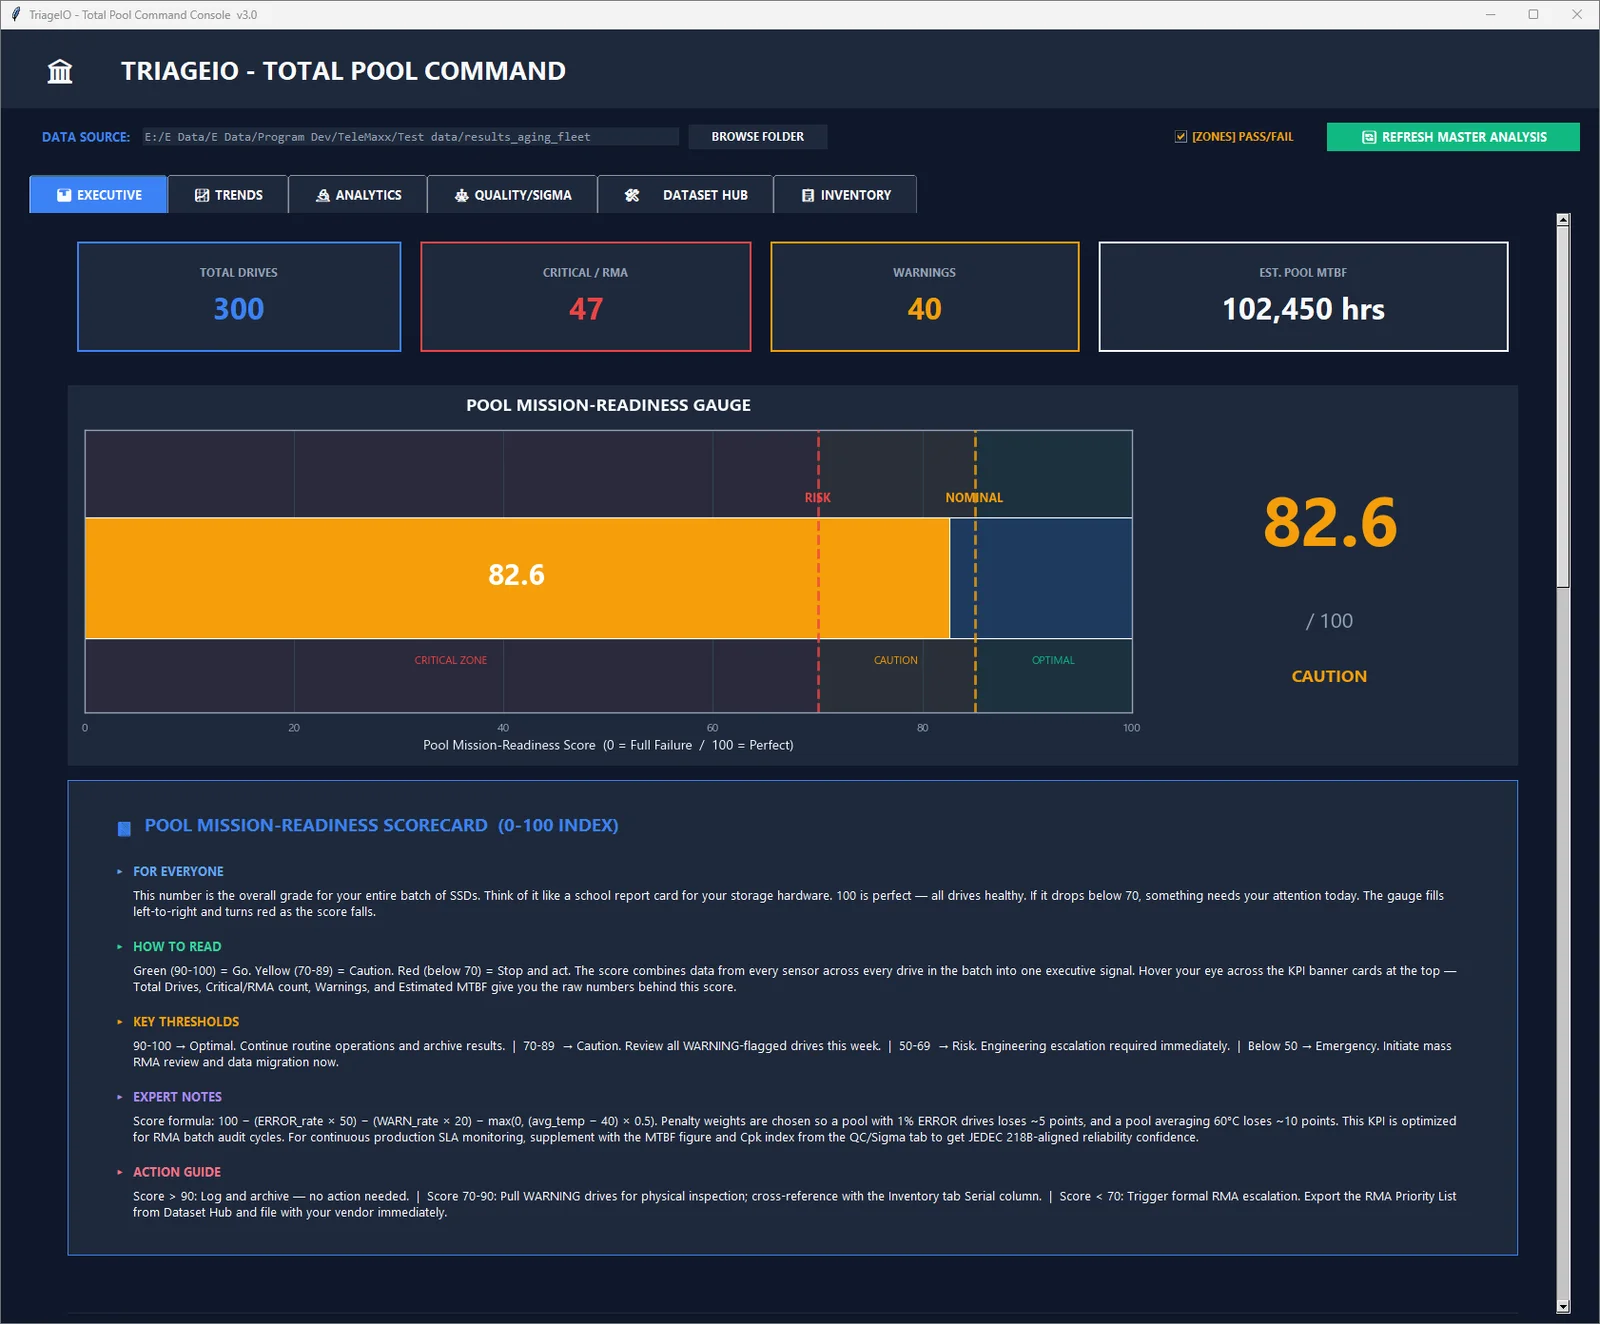
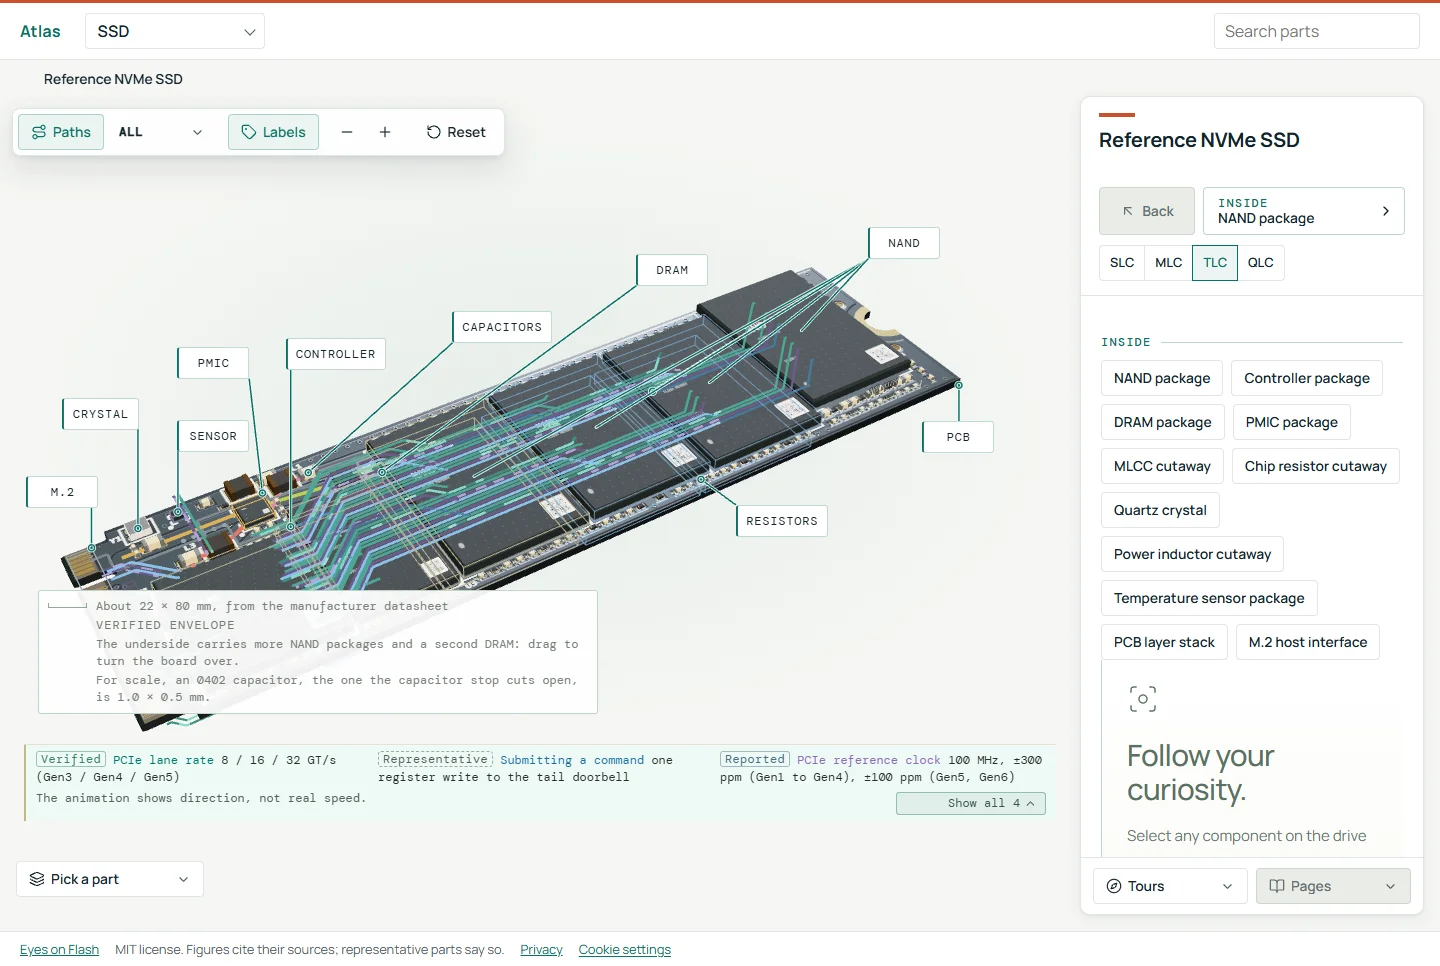
Memory errors on a server rarely announce themselves. ECC lets the memory controller count errors, and Linux exposes those counts through its EDAC subsystem, which DDR5 for Builders explains for reading errors on a running system. RAM BAM puts those counters to work as a test. It loads ECC DDR5 with four existing stress tools one after another and checks the counters before and after each phase. Today it is experimental and has not run on real ECC hardware with the current scripts. If you want a tool that scores whole-platform stress runs and keeps an evidence bundle, PS-FU is the sibling project.
Introducing RAM BAM
Scripts for Linux drive y-cruncher, stressapptest, stress-ng and memtester under a small protocol. They track the kernel’s EDAC error counters throughout. Each run stops at the first uncorrectable error, and its logs become a summary report.
This project is experimental and pre-1.0, and it has not been run on real ECC hardware with the current scripts, so read the limitations before you trust a result.
Why it exists
Each memory stress tool loads DIMMs differently. y-cruncher leans on FFT and NTT arithmetic, stressapptest copies data and verifies it with a CRC, memtester writes deterministic patterns, and stress-ng brings kernel VM stressors. Whether running the mix finds faults that a single tool misses is the open question this project was written to answer. It is not established, and the methodology notes in the repository say so.
What it does
- Snapshots the EDAC corrected (CE) and uncorrectable (UE) counters.
- Runs the phases one after another:
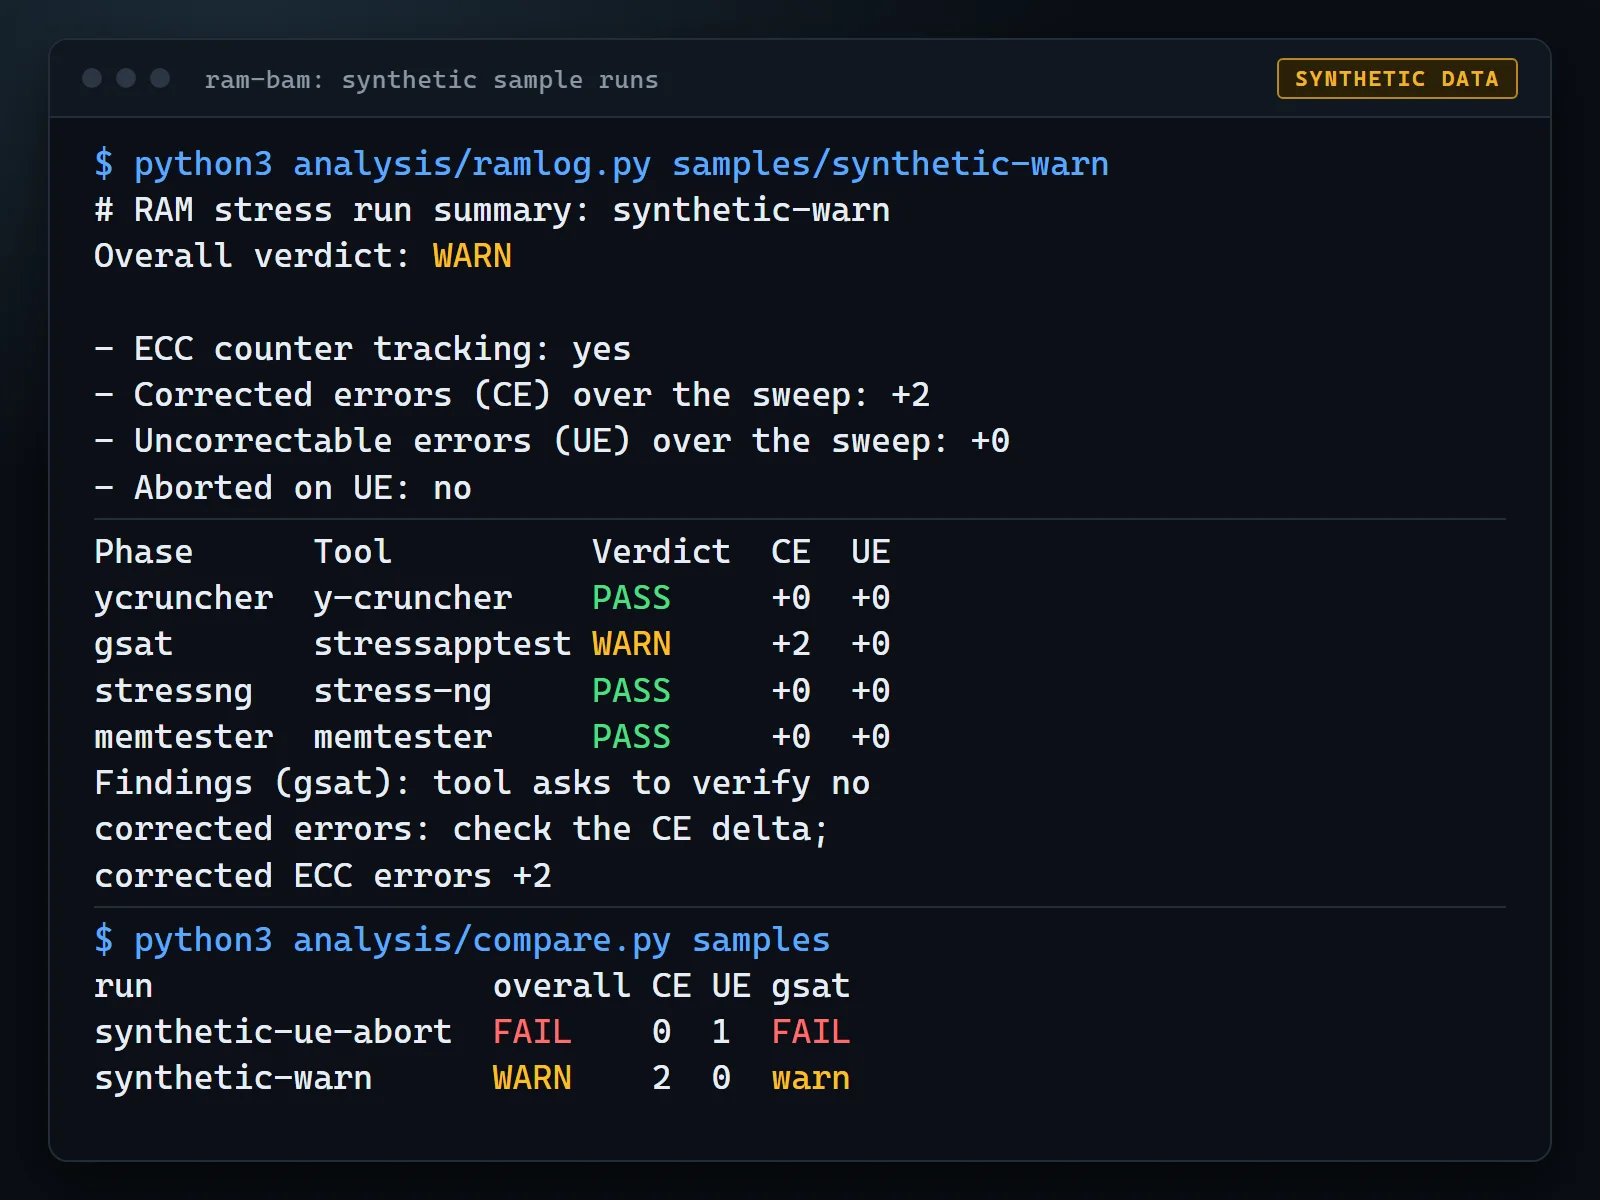
ycruncher,gsat(stressapptest),stressng,memtester. Each phase gets EDAC snapshots before and after. - Polls the UE counter while a phase runs. The first rise above the baseline kills the phase, skips the rest and exits with code 3.
- Produces
summary.mdandsummary.jsonwith a verdict for each phase and for the run.
The verdicts are deliberately cautious. A tool-reported error, a non-zero tool exit, any UE or a UE abort gives a FAIL. Corrected errors, a tool hitting its hard time limit or missing EDAC data give a WARN. A phase that did not finish is INCOMPLETE. A PASS shows no tool error and no ECC counter movement in this run, which the README describes as absence of evidence rather than proof of a healthy module.
Three profiles set the time per phase: fast (300, 600, 300 and 300 seconds), standard and thorough. They are starting points, not validated durations.
Honest limitations
No known-faulty module has been run through this protocol
Its detection rate, false-positive rate and value over a single tool such as stress-ng are unknown.
The scripts are a rewrite
The earlier prototype ran one short smoke test on one platform with a clean result. The current scripts have been tested against stub tools and a fake EDAC tree on a non-Linux development machine, never with the real tools on real ECC hardware.
y-cruncher handling is unverified
Passing output was seen in a real log, but failure detection is a conservative keyword scan, and the timing flags need checking against the version you download.
EDAC visibility varies
Some platforms do not expose DDR5 counters, and errors corrected by on-die ECC are not reported to the OS at all. Without counters the run is refused, or capped at WARN with --allow-no-edac.
No per-DIMM attribution
Memory controllers interleave, so a run tests the whole configuration. To test one module, install only that module.
The UE abort is best effort
A machine check that resets the host ends the run before any abort logic can act.
Get started
You need Linux, bash 4 or newer, root for real runs, a loaded EDAC driver, Python 3.9 or newer and the four stress tools. Nothing third-party is bundled, and scripts/fetch-tools.sh gets the tools from upstream. One caveat: no y-cruncher SHA-256 is pinned yet, so that download is not integrity-verified until you pin a hash yourself.
Start with a dry run, which resolves tools and RAM sizes and touches nothing:
scripts/ram-eval.sh --dry-run --profile fast demo-01
sudo scripts/ram-eval.sh --profile standard demo-01
python3 analysis/ramlog.py results/demo-01 --write
Use a neutral run-id. It ends up in file names and reports, so keep serial numbers and hostnames out of it.
Safety notes
These scripts deliberately load 75% of RAM by default and every CPU core for hours. Run them only on a machine you can afford to lose access to.
- Never run on a production host or one with unsaved work. Low memory can trigger the OOM killer, swap thrashing or a full hang.
- A machine check or kernel panic from a bad DIMM can reset the host without writing results. Have console or BMC access.
- Every phase runs under a timeout, Ctrl-C stops the running phase and exits 130, and
--ram-pctlowers the memory share on small or busy machines. - Try
--dry-runand thefastprofile first.
Open source under the MIT license
RAM BAM is open source under the MIT License, with the methodology notes, results template and synthetic samples on GitHub. The results table in the template is empty on purpose, because no multi-DIMM results exist yet. If you run it on known-good or known-faulty modules, those results are exactly what the project is missing.