Part 1 of this series explained the SLC cache in principle. It’s a fast region that takes writes at full speed until it fills, then the speed drops, and it refills slowly while the drive sits idle. Part 2 covered synthetic tools that never get that far. CrystalDiskMark writes a 1GiB test file by default, and the smallest cache I’ve measured held 12.7GB, so its write result is the cache and nothing else.
Benchmarking 101
SSD Benchmarking 101, Part 4: Sustained Writes and the Cache Cliff
Run one long write to find where an SSD's SLC cache ends, how fast the drive writes after it, and how much speed comes back after idle.
On this page 6 sections
This part runs one long sequential write that goes past the cache and logs its rate every second. Below are its settings, the rules I use to read the curve it draws, and what 65 retail drives on my test bench did with it.
Why a short write only measures the cache
Any write smaller than the cache goes entirely into it. On 51 of 64 drives with CrystalDiskMark data, the burst of my sustained write ran within 5% of CrystalDiskMark’s SEQ1M Q8T1 write result. For those drives the short test and the start of the long one measured the same thing. At the median, a cache took 39 s to fill at full speed. A file copy of a few gigabytes never reaches the end of it, but a game install, a video project or a clone of a full drive can.
Why a short write only measures the cache
CrystalDiskMark’s default test file fits inside every cache I measured
Default test file against measured SLC cache sizes, 64 retail drives
How I run the write
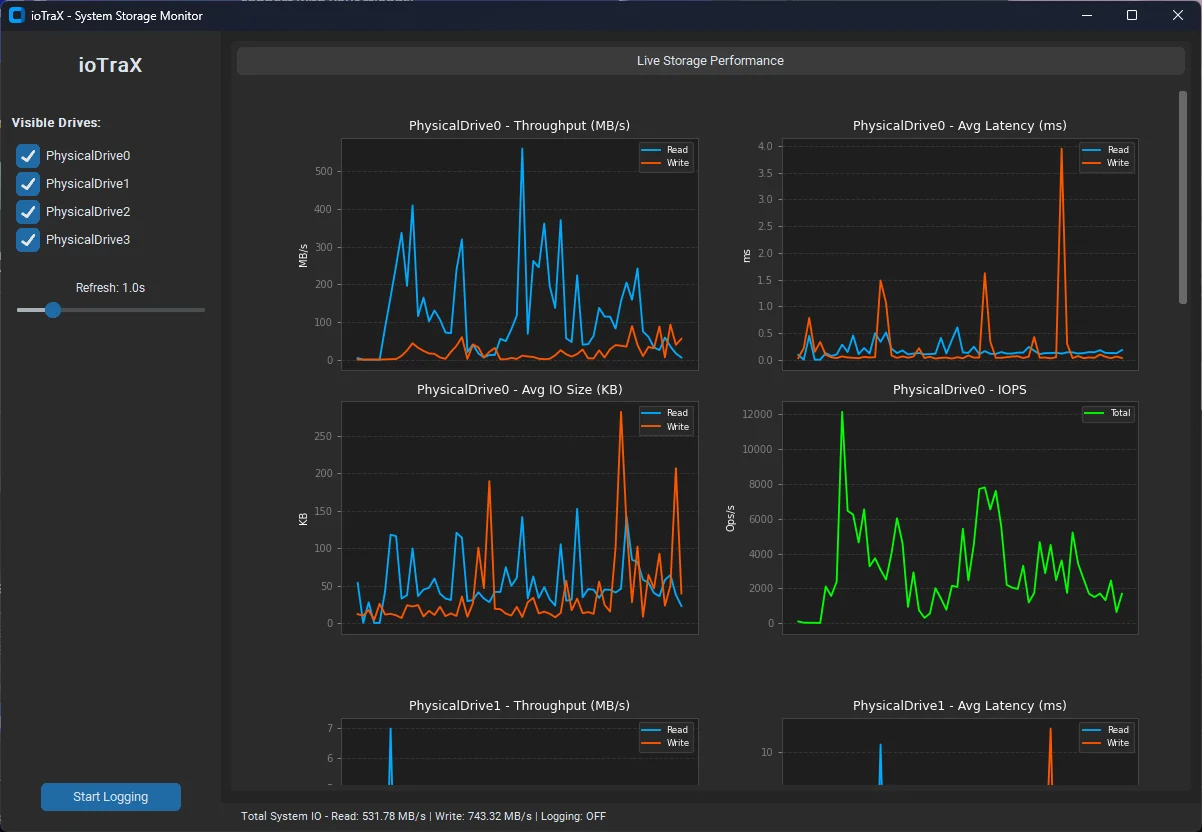
I use one Iometer 1.1.0 access spec with 1MiB transfers, 100% writes and 0% random, aligned to 1MiB. Iometer logs the write rate about once a second for the whole run. My runs lasted from about 15 minutes to about 2 hours, and on 39 of 64 drives the run wrote at least the drive’s full capacity.
Start from the host and drive state Part 1 sets up. Any tool that records the rate over time will do the same job, such as fio with --rw=write and a 1MiB block size, as long as it logs the rate in short intervals instead of reporting one average at the end.
How I run the write
One access spec, logged second by second until the cache is gone
The sustained write test on my test bench, Iometer 1.1.0
Reading the curve
A write rate logged every second draws a curve with a flat stretch at burst speed, a drop, and a slower stretch after it. I read three numbers off that curve with fixed rules. Burst speed is the best 5-row rolling median in the first 60 rows, about the first minute. The cliff is the first row where the smoothed speed falls under 0.6 times the burst and stays there for 30 rows. Cache size is the gigabytes written before the cliff.
Those rules keep noise out of the result, since a dip of a few seconds doesn’t count as a cliff while a drop that holds for 30 rows does.
Reading the curve
Three numbers read off one curve with fixed rules
An illustrative write rate over time, with the rules every run is judged by
What 64 cliffs looked like
Of 65 retail drives, 64 dropped off a cliff before their run ended. Caches ranged from 12.7GB to 1,045.5GB, and the median held 214.3GB. After the cliff, the median drive kept 26.5% of its burst speed, and the range ran from 3.7% to 58.9%. Of the 64, 23 averaged under 1,000MB/s after the cache and 11 under 500MB/s.
PCIe 4.0 drives had a median burst 82% above PCIe 3.0 drives, but after the cache that lead shrank to 34%, a comparison the box speed myth works through with the same runs. After-cache speed is the rate a long transfer spends most of its time at, and a drive’s rated speed doesn’t state it.
What 64 cliffs looked like
The median drive kept about a quarter of its burst after the cache
After-cache average as a share of burst speed, 64 retail drives with a cliff
Recovery after idle
After the main run I let each drive sit idle and wrote again, after 30 seconds, 1 minute, 5 minutes and 30 minutes, to see how much fast cache came back. Whether the main run had filled the drive decided the answer. These idle runs come from a smaller set of drives with all four idle writes on file, so the counts differ from the 64 above. On the 35 drives the run had filled, the median drive wrote 0GB at burst speed after every gap.
On the 20 drives that still had room, the median came back to about 30GB after 30 seconds, 42GB after 1 minute, 99GB after 5 minutes and 125GB after 30 minutes. Once the Cache Fills, the Drive Stays Slow works through those runs drive by drive.
Recovery after idle
Idle brought speed back only to drives that weren’t full
Median GB written at burst speed after an idle gap, retail drives on my test bench
What to report from a sustained write
A sustained write result needs more than one number, and I report these and look for them in anyone else’s:
- burst speed in MB/s, and how long it lasted
- cache size in GB, and the time to the cliff
- the after-cache average in MB/s, and its share of the burst
- whether the run wrote the drive’s full capacity
- how much speed came back after idle, and how full the drive was when it sat
What to report from a sustained write
Most caches ran out within two minutes of a steady write
Drives whose SLC cache filled within a given time, of 64 retail drives with a cliff
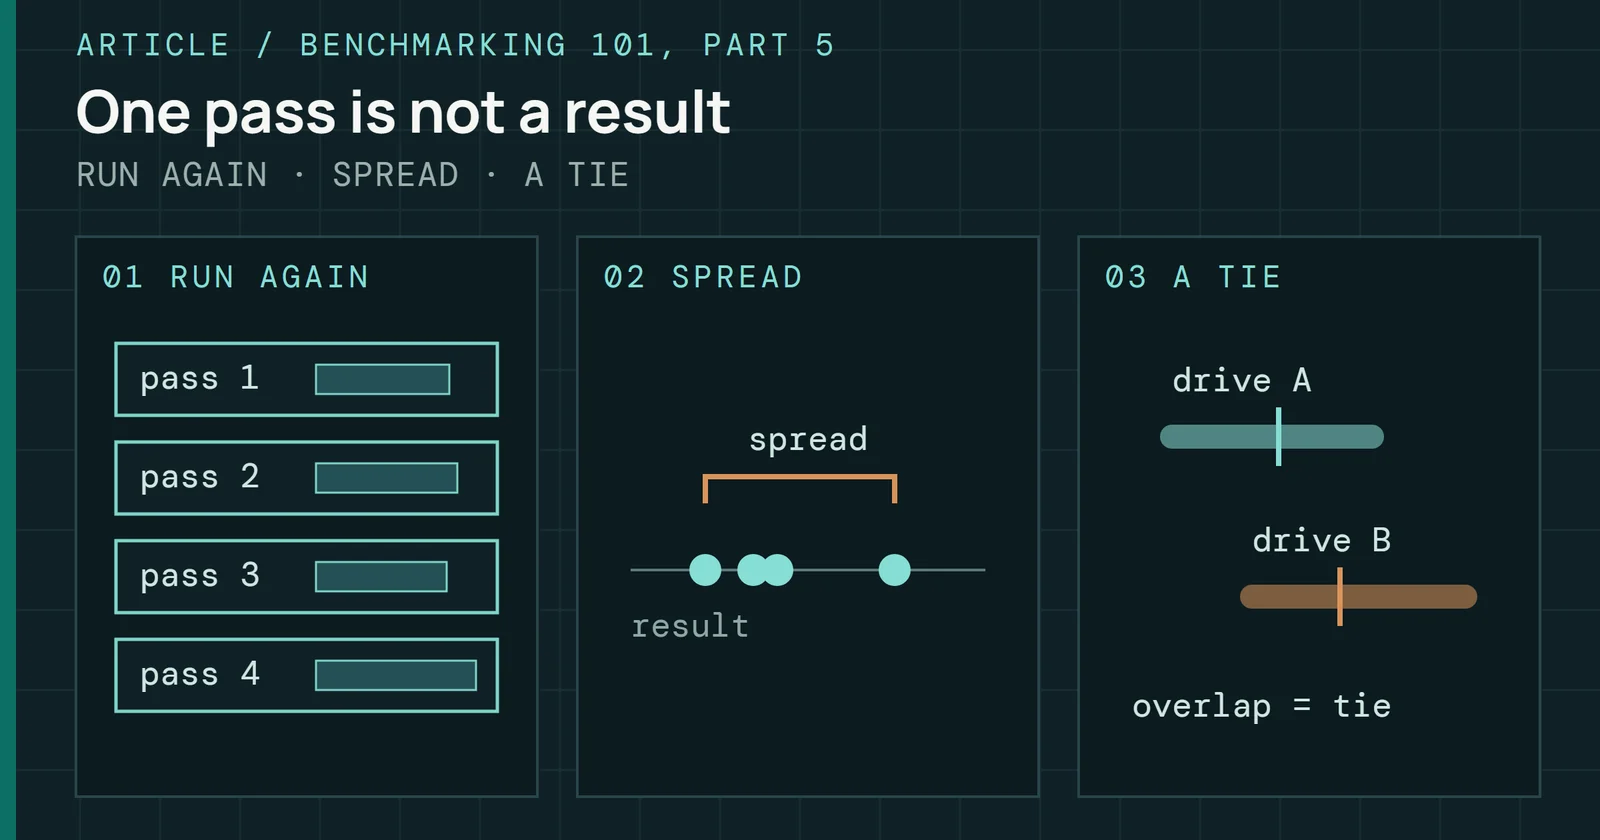
A result that gives only the burst has measured the cache. Part 5 looks at how much any of these numbers moves from one pass to the next, and how many passes it takes before a gap between two drives means something.
Sources
Primary is the original paper, standard or datasheet. Secondary is a review, a vendor summary or a news report. Measured is my own test data.
Show all 1 sources
- MeasuredThe author’s own measurements